trim_extrema#
Trims local extremes in the greyscale values of an image. It is useful for flattening peaks.
Import Packages#
import matplotlib.pyplot as plt
import numpy as np
from edt import edt

import porespy as ps

ps.visualization.set_mpl_style()
im#
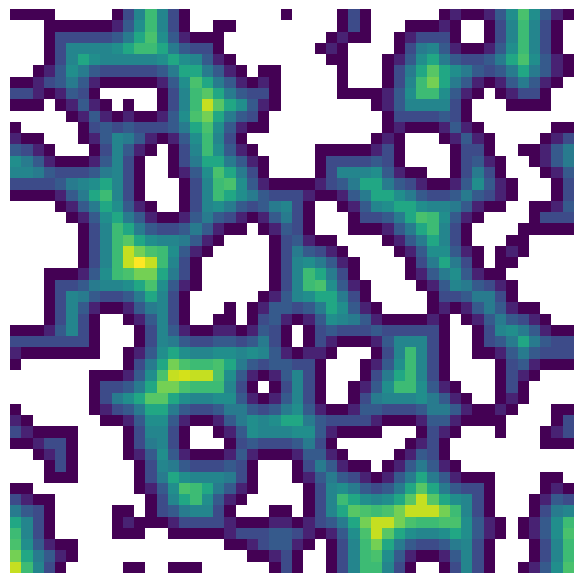
The function works on 2D or 3D image with greyscale values, such as a distance transform:
im = ps.generators.blobs(shape=[50, 50], porosity=0.7)
dt = edt(im)

plt.figure(figsize=[6, 6])
plt.imshow(dt / im)
plt.axis(False);
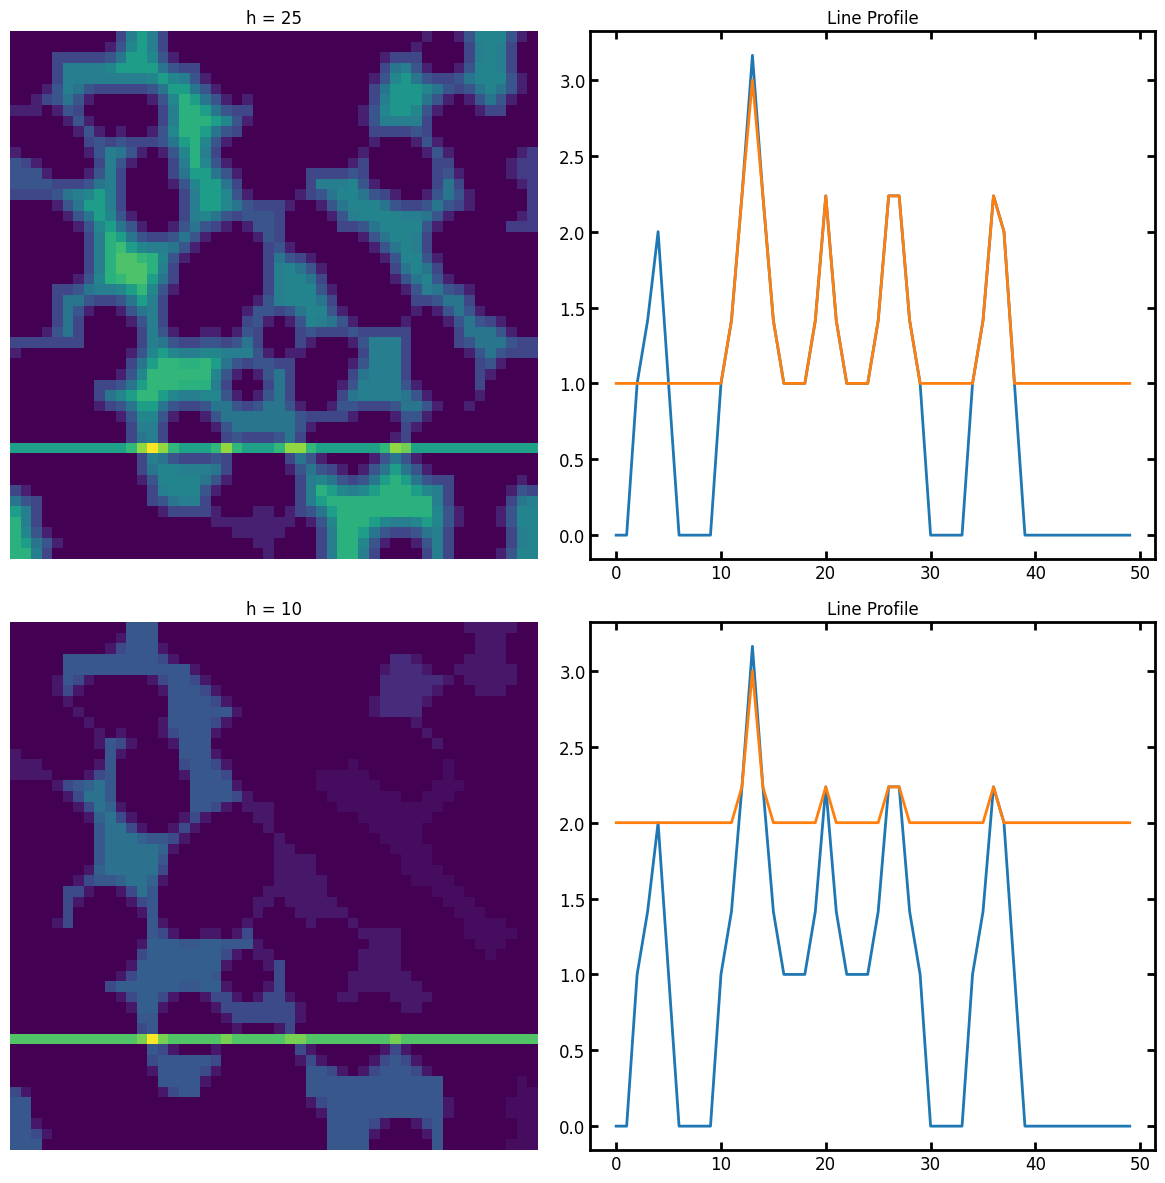
dt1 = ps.filters.trim_extrema(im=dt, h=1, mode="maxima")
dt2 = ps.filters.trim_extrema(im=dt, h=2, mode="maxima")

fig, ax = plt.subplots(2, 2, figsize=[12, 12])

stripe = np.zeros_like(dt)
stripe[10, :] = dt.max() / 2

ax[0][0].imshow(dt1 + stripe)
ax[0][0].set_title("h = 25")
ax[0][0].axis(False)
ax[0][1].plot(dt[10, :])
ax[0][1].plot(dt1[10, :])
ax[0][1].set_title("Line Profile")

ax[1][0].imshow(dt2 + stripe)
ax[1][0].axis(False)
ax[1][0].set_title("h = 10")
ax[1][1].plot(dt[10, :])
ax[1][1].plot(dt2[10, :])
ax[1][1].set_title("Line Profile");
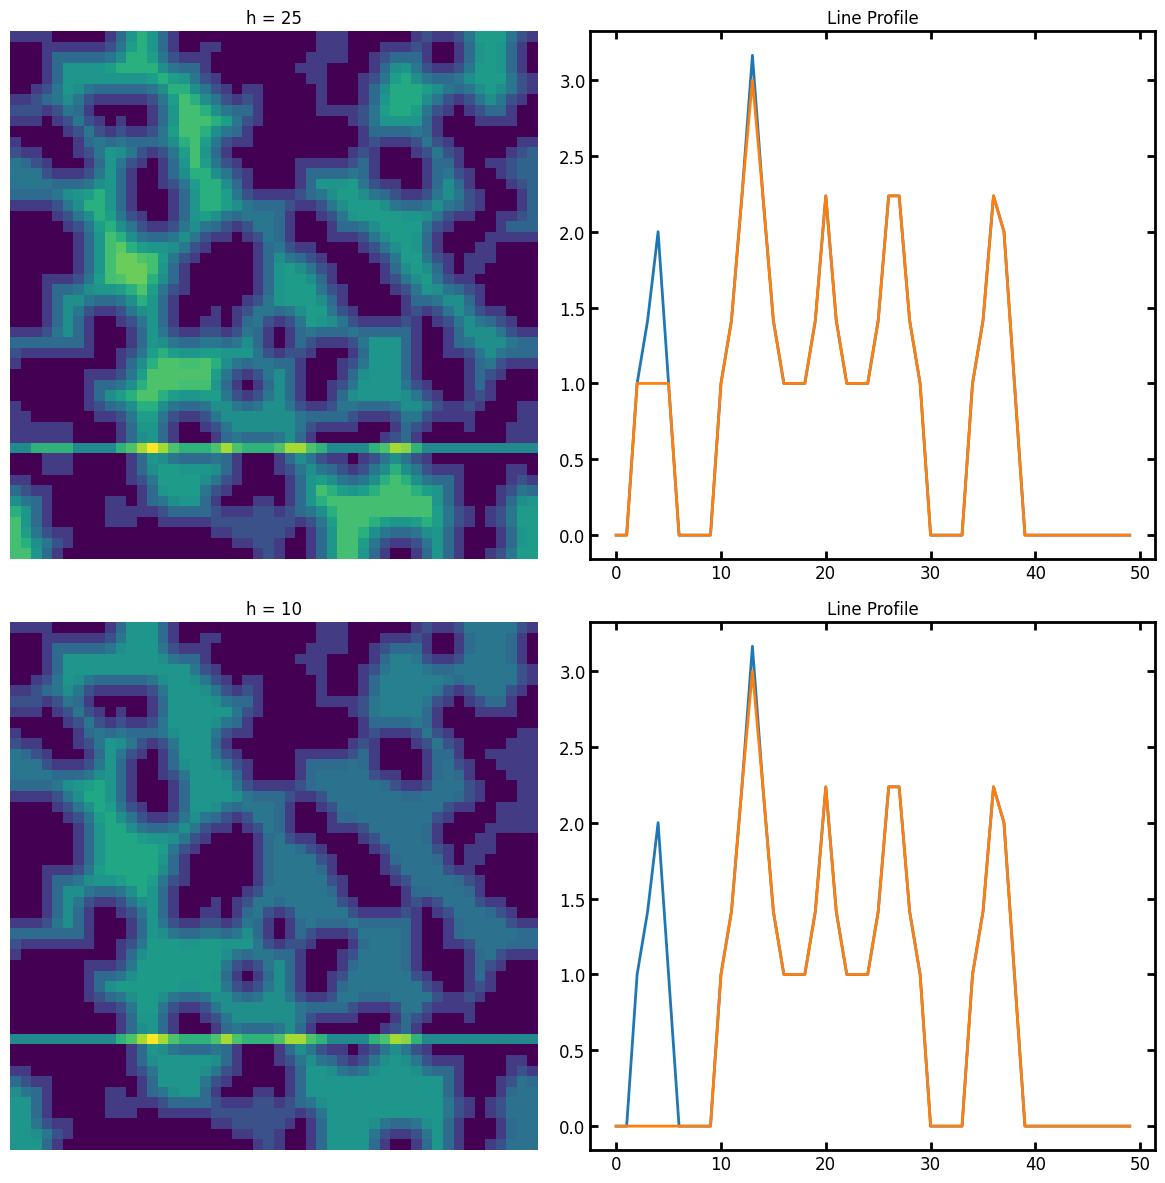
mode#
The available modes are maxima, minima, and extrema. These modes specify which extremes to remove. Minima and maxima modes trim the maximum and minimum extremes respectively. The extrema mode trims both extremes.
dt1 = ps.filters.trim_extrema(im=dt, h=1, mode="minima")
dt2 = ps.filters.trim_extrema(im=dt, h=2, mode="minima")

fig, ax = plt.subplots(2, 2, figsize=[12, 12])

ax[0][0].imshow(dt1 + stripe)
ax[0][0].set_title("h = 25")
ax[0][0].axis(False)
ax[0][1].plot(dt[10, :])
ax[0][1].plot(dt1[10, :])
ax[0][1].set_title("Line Profile")

ax[1][0].imshow(dt2 + stripe)
ax[1][0].axis(False)
ax[1][0].set_title("h = 10")
ax[1][1].plot(dt[10, :])
ax[1][1].plot(dt2[10, :])
ax[1][1].set_title("Line Profile");
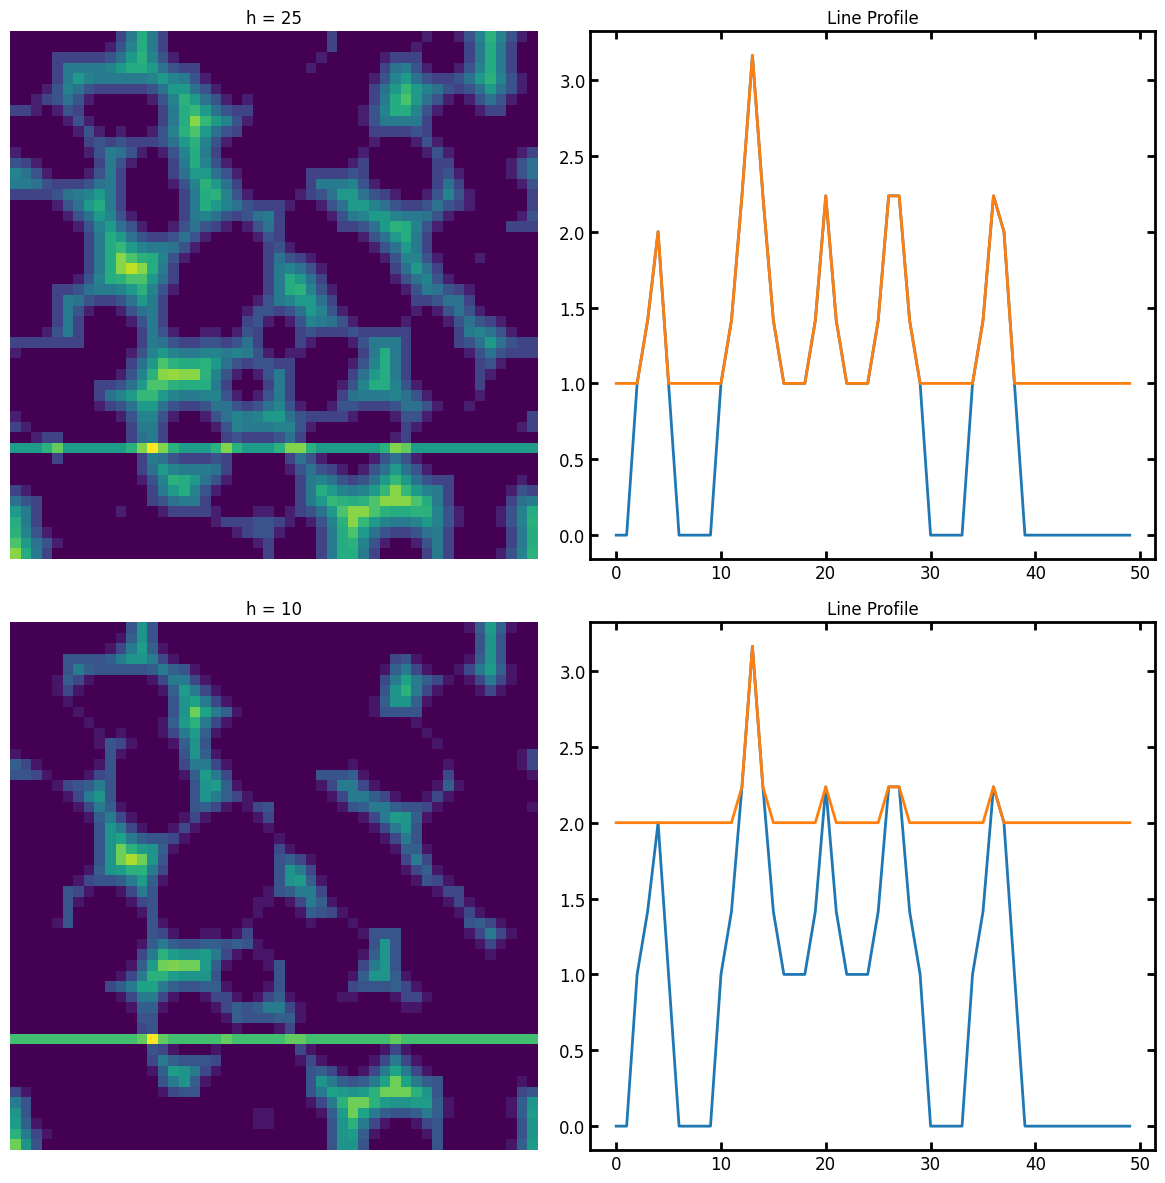
dt1 = ps.filters.trim_extrema(im=dt, h=1, mode="extrema")
dt2 = ps.filters.trim_extrema(im=dt, h=2, mode="extrema")

fig, ax = plt.subplots(2, 2, figsize=[12, 12])

ax[0][0].imshow(dt1 + stripe)
ax[0][0].set_title("h = 25")
ax[0][0].axis(False)
ax[0][1].plot(dt[10, :])
ax[0][1].plot(dt1[10, :])
ax[0][1].set_title("Line Profile")

ax[1][0].imshow(dt2 + stripe)
ax[1][0].axis(False)
ax[1][0].set_title("h = 10")
ax[1][1].plot(dt[10, :])
ax[1][1].plot(dt2[10, :])
ax[1][1].set_title("Line Profile");