Making blobs#
import matplotlib.pyplot as plt
import numpy as np

import porespy as ps

ps.visualization.set_mpl_style()
np.random.seed(10)
The blobs function works by generating an image of random noise then applying a Gaussian blur. The creates a correleated field with a Gaussian distribution. The function will then normalize the values back to a uniform distribution, which allow direct thresholding of the image to obtain a binary images (i.e. solid and void).
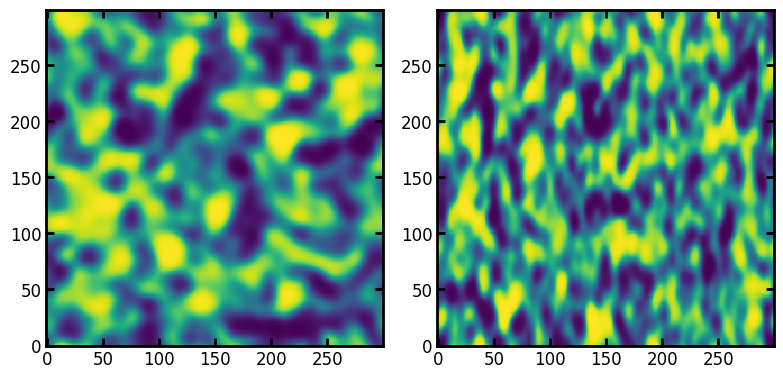
Let’s start by illustrating the correlated noise field returned by the function. It’s possible to create directional correlation by specifying the blobiness argument as an array with a different value in each direction, as follows:
im1 = ps.generators.blobs(shape=[300, 300], porosity=None, blobiness=[1, 1])
im2 = ps.generators.blobs(shape=[300, 300], porosity=None, blobiness=[1, 2])
fig, ax = plt.subplots(1, 2, figsize=[8, 4])
ax[0].imshow(im1)
ax[1].imshow(im2);
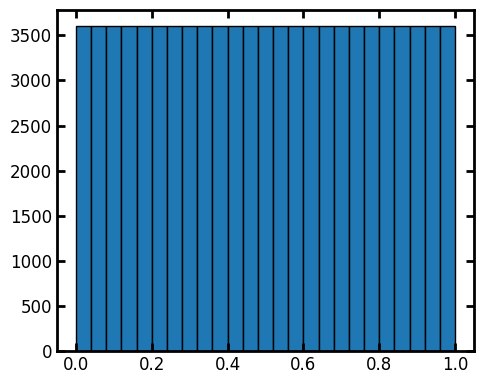
The distribution of the values in these images has been renormalized to be a uniform distribution, which can be confirmed by plotting a histogram. Because the image is not very large, the histogram is not perfectly flat:
fig, ax = plt.subplots(figsize=(5, 4))
ax.hist(im1.flatten(), bins=25, edgecolor="k");
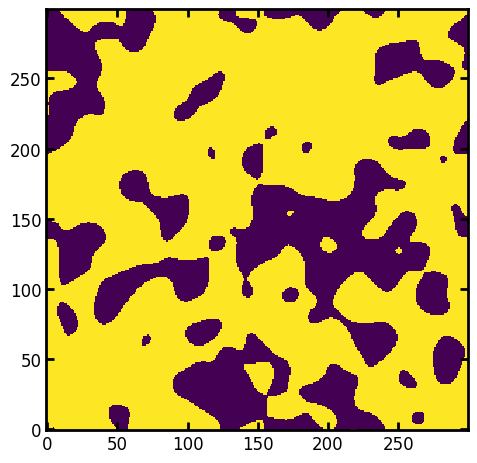
Next is easy to threshold the noise field to produce a binary image of ‘solid’ and ‘void’:
im = im2 < 0.5
fig, ax = plt.subplots()
ax.imshow(im);

And we can check the porosity of the thresholded image:
p = im.sum() / im.size
print(f"The porosity is: {p:.3}")
The porosity is: 0.5
Which is reasonably close to the 50% value the threshold was set at.
It’s also possible to receive an already thresholded image from the function directly by specifying the porosity argument:
im = ps.generators.blobs(shape=[300, 300], porosity=0.7)
fig, ax = plt.subplots()
ax.imshow(im);
print(f"The porosity is: {im.sum() / im.size:.3}")
The porosity is: 0.7
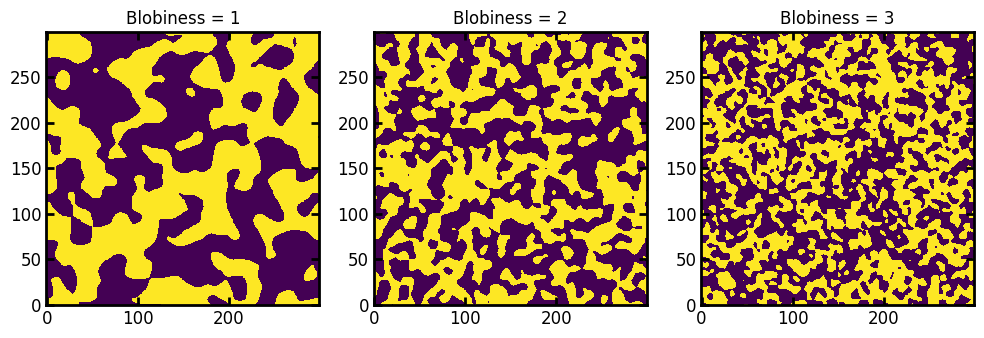
Finally, it’s possible to change the size of the structure by adjusting the blobiness where larger values means more blobs in the image:
im1 = ps.generators.blobs(shape=[300, 300], porosity=0.5, blobiness=1)
im2 = ps.generators.blobs(shape=[300, 300], porosity=0.5, blobiness=2)
im3 = ps.generators.blobs(shape=[300, 300], porosity=0.5, blobiness=3)
fig, ax = plt.subplots(1, 3, figsize=[10, 4])
ax[0].imshow(im1)
ax[1].imshow(im2)
ax[2].imshow(im3)
ax[0].set_title("Blobiness = 1")
ax[1].set_title("Blobiness = 2")
ax[2].set_title("Blobiness = 3");