Visualizing a tif image in Paraview#
PoreSpy visualization class includes varieties of visualization methods for quick plotting, mesh, 2D visualization, etc. However, for a detailed 3D visualization Paraview can be used to visualize the images generated by PoreSpy. In this tutorial we will generate a .tif image using PoreSpy and visualize the image in Paraview. Note that Paraview includes varieties of filters such as slice, threshold, contours, etc for different visualization purposes. For more details visit Paraview.
import imageio
import matplotlib.pyplot as plt
import numpy as np

import porespy as ps
Let’s first generate a test image in PoreSpy using the blobs generator.
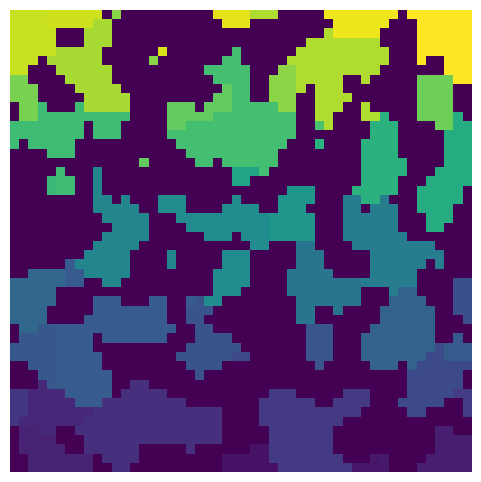
np.random.seed(10)
im = ps.generators.blobs(shape=[50, 50, 50])
snow = ps.filters.snow_partitioning(im)
regions = snow.regions
fig, ax = plt.subplots(1, 1, figsize=[6, 6])
ax.imshow(regions[:, :, 20], origin="lower", interpolation="none")
ax.axis(False);
We can then save the ragions as a .tif format to be imported in Paraview.
imageio.volsave("regions.tif", np.array(regions.astype("uint8")))
Now let’s visualize the image in Paraview. First open the image using TIFF Series Reader in Paraview:

Now regions.tif in the Pipeline Browser represents the reader of the image data. To the left of this object there is an eye toggle icon. This icon indicates whether or not the object is shown in the view window on the right. You can control showing or not showing the image by left-clicking on the icon. Then click on Apply to apply the change:

Now the object default representation in the view window is outline with solid coloring. Select surface representation and Tiff scalars for coloring. Then click on Apply. The view window then shows a 3D image colored by the values of each voxel (here region labels):

You can change the color map by clicking on the Choose Preset and selecting a colormap:

Now the regions are colored by the new selected colormap:
