size_to_seq#
Converts values of invasion size into sequence numbers.
import numpy as np
import porespy as ps
import matplotlib.pyplot as plt
from edt import edt

ps.visualization.set_mpl_style()
Generate an image containing invasion sizes using the porosimetry function:
np.random.seed(0)
im = ps.generators.blobs([200, 200], porosity=0.5)
inv = ps.filters.porosimetry(im)
size#
The sizes are produced by porosimetry for instance:
seq = ps.filters.size_to_seq(size=inv)
fig, ax = plt.subplots(1, 2, figsize=[8, 4])
ax[0].imshow(inv, origin="lower", interpolation="none")
ax[0].set_title("Invasion map by size")
ax[0].axis(False)
ax[1].imshow(seq, origin="lower", interpolation="none")
ax[1].set_title("Invasion map by sequence")
ax[1].axis(False);

im#
The boolean image can be optionally passed into so that uninvaded regions can be differentiated from solid (if both are labelled 0).
seq = ps.filters.size_to_seq(size=inv, im=im)
fig, ax = plt.subplots(1, 2, figsize=[8, 4])
ax[0].imshow(inv, origin="lower", interpolation="none")
ax[0].set_title("Invasion map by size")
ax[0].axis(False)
ax[1].imshow(seq, origin="lower", interpolation="none")
ax[1].set_title("Invasion map by sequence")
ax[1].axis(False);
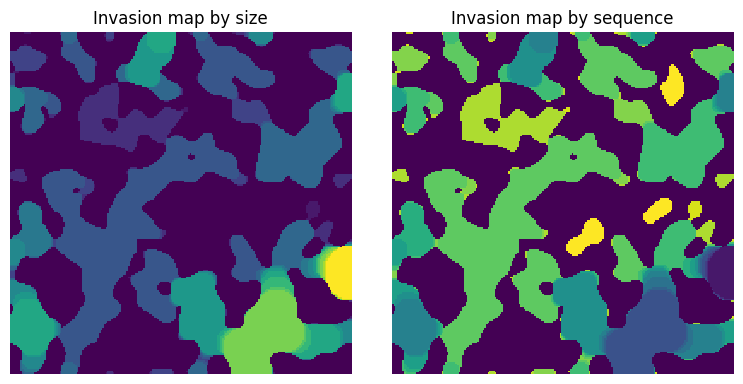
In the right image above, there can be seen several regions that are isolated by the void space. They are colored yellow indicating they are filled last. This is caused by the fact that these regions were uninvaded so were set to 0, which makes them the last regions invaded. This may or may not be desired.
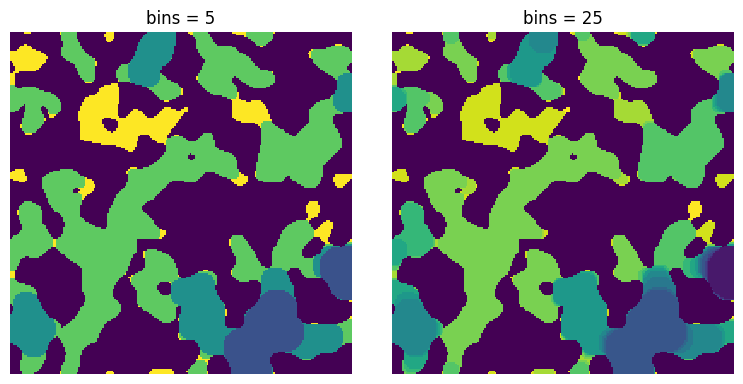
bins#
The number of sequence values to when converting sizes. The default is 25.
fig, ax = plt.subplots(1, 2, figsize=[8, 4])

bins = 5
seq = ps.filters.size_to_seq(size=inv, bins=bins)
ax[0].imshow(seq, origin="lower", interpolation="none")
ax[0].set_title(f"bins = {bins}")
ax[0].axis(False)

bins = 25
seq = ps.filters.size_to_seq(size=inv, bins=bins)
ax[1].imshow(seq, origin="lower", interpolation="none")
ax[1].set_title(f"bins = {bins}")
ax[1].axis(False);