insert_shape#
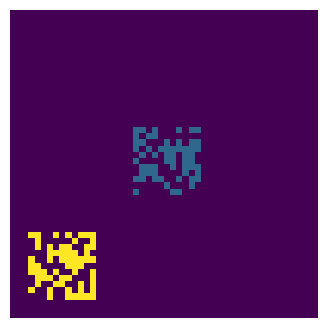
Inserts sub-image into a larger image at the specified location
import matplotlib.pyplot as plt
import numpy as np
import porespy as ps
im = np.zeros([50, 50], dtype=int)
shape = np.random.rand(11, 11) > 0.5
im = ps.generators.insert_shape(im=im, element=shape, center=[25, 25])

fig, ax = plt.subplots(1, 1, figsize=[4, 4])
ax.imshow(im, interpolation="none", origin="lower")
ax.axis(False);

value#
The value of the inserted voxels can be specified:
shape = np.random.rand(11, 11) > 0.5
im = ps.generators.insert_shape(im=im, element=shape, center=[8, 8], value=3)

fig, ax = plt.subplots(1, 1, figsize=[4, 4])
ax.imshow(im, interpolation="none", origin="lower")
ax.axis(False);

mode#
If mode='overwrite' then the inserted image will overwrite anything present in the image. If mode='overlay' then the existing values will be added to inserted ones.
im = np.zeros([50, 50], dtype=int)

shape = np.ones([11, 11])
im = ps.generators.insert_shape(im=im, element=shape, center=[25, 25], value=3)
im = ps.generators.insert_shape(
    im=im, element=shape, center=[18, 18], value=5, mode="overwrite"
)

fig, ax = plt.subplots(1, 2, figsize=[8, 4])
ax[0].imshow(im, interpolation="none", origin="lower")
ax[0].axis(False)

im = ps.generators.insert_shape(im=im, element=shape, center=[12, 12], value=7, mode="overlay")
ax[1].imshow(im, interpolation="none", origin="lower")
ax[1].axis(False);

center and corner#
Specifies where to insert the shape. Only one of the other can be supplied. If center, then the center of the inserted image will be placed on at the provide locations. In this case the inserted image must have all odd-length dimensions so that a true center can be found. Alternatively, the corner can be specified which lines up the bottom-left corner of the inserted image with the given coordinates.
im = np.zeros([50, 50], dtype=int)

shape = np.ones([11, 11])
im = ps.generators.insert_shape(im=im, element=shape, center=[35, 35], value=2)
im = ps.generators.insert_shape(im=im, element=shape, corner=[10, 10], value=3)

fig, ax = plt.subplots(1, 1, figsize=[4, 4])
ax.imshow(im, interpolation="none", origin="lower")
ax.axis(False);

