satn_to_movie#
Produces a movie of the invasion sequence from ibip filter. This method can be applied for visualizing image-based invasion percolation algorithm.
import matplotlib.pyplot as plt
import numpy as np
from IPython.display import HTML
import porespy as ps
ps.visualization.set_mpl_style()
im#
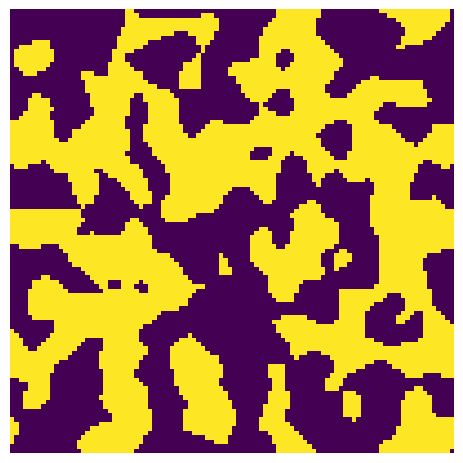
The input image is a Boolean image True values indicating the void voxels and False for solid. Let’s create a test image:
np.random.seed(10)
im = ps.generators.blobs(shape=[100, 100], blobiness=1)
fig, ax = plt.subplots()
ax.imshow(im, origin="lower", interpolation="none")
ax.axis(False);
satn#
The saturation image can be generated from ibip data using seq_to_satn method. The satn is the image of porous material where each voxel indicates the global saturation at which it was invaded. Voxels with 0 values indicate solid and and -1 indicate uninvaded.
bd = np.zeros_like(im, dtype=bool)
bd[:, 0] = 1
bd *= im
out = ps.simulations.ibip(im=im, inlets=bd)
inv_seq, inv_size = out.im_seq, out.im_size
satn = ps.filters.seq_to_satn(seq=inv_seq, im=im)
Now we can create an animation of the invasion sequence using satn_to_movie: (To save animation as a file and for visualizing use animation.save)
mov = ps.visualization.satn_to_movie(im=im, satn=satn)
mov_image_based_ip = mov.to_jshtml()
HTML(mov_image_based_ip)
cmap#
The Colormap used to map invasion sequence values to colors. By default the cmap is ‘viridis’.
mov = ps.visualization.satn_to_movie(im=im, satn=satn, cmap="plasma")
image_based_ip_cmap = mov.to_jshtml()
0%| | 0/390 [00:00<?, ?it/s]
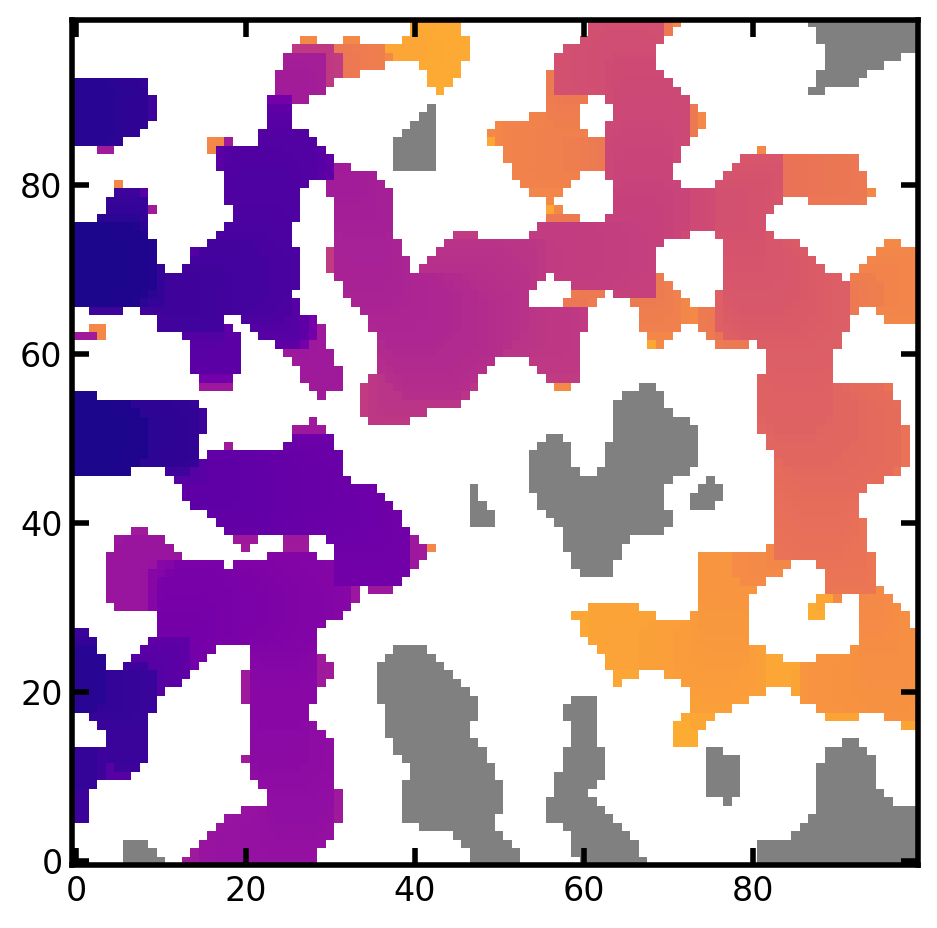
HTML(image_based_ip_cmap)
c_under#
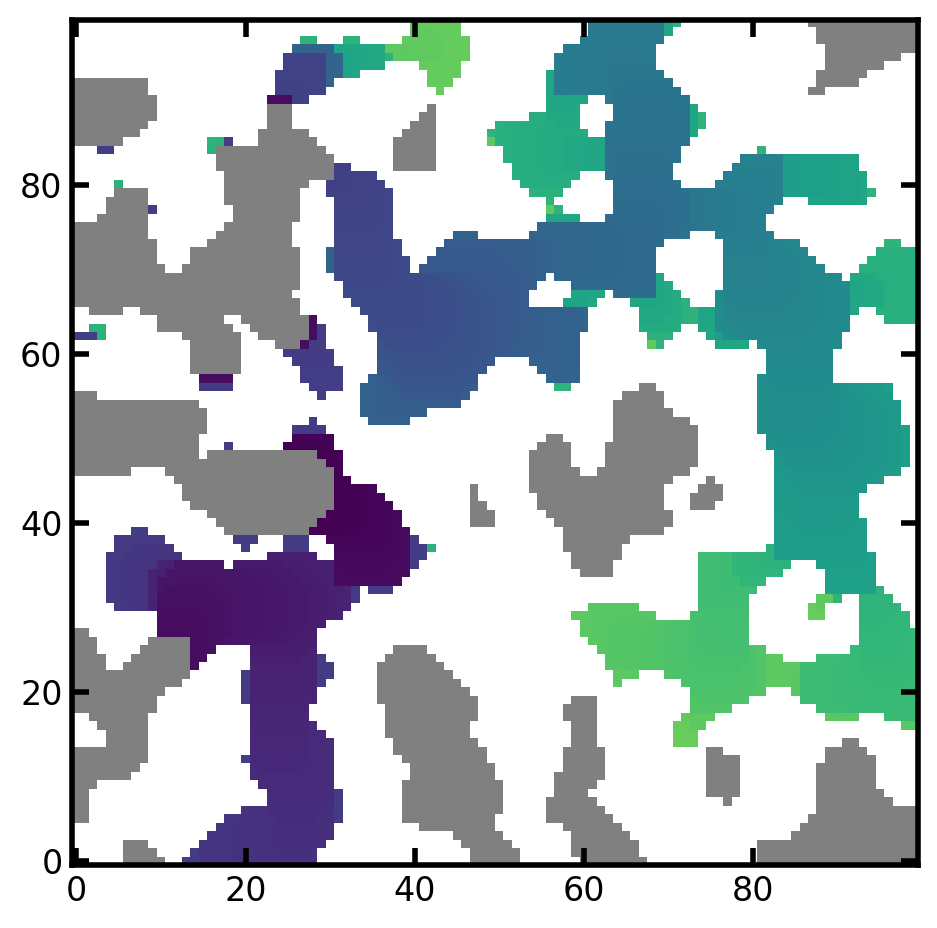
Colormap to be assigned to the lowest color bound (under color) in the color map. The voxeled colored by c_under are the uninvaded void space. The default under color is grey.
mov = ps.visualization.satn_to_movie(im=im, satn=satn, c_under="green")
image_based_ip_c_under = mov.to_jshtml()
0%| | 0/390 [00:00<?, ?it/s]
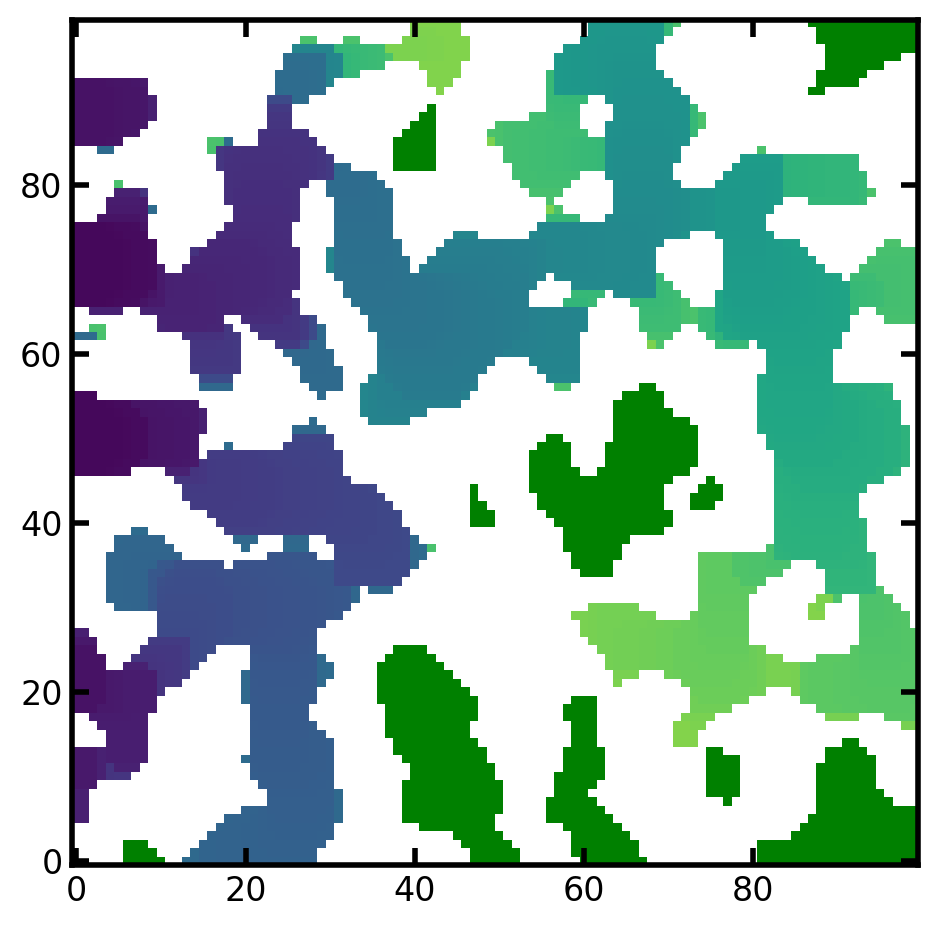
HTML(image_based_ip_c_under)
c_over#
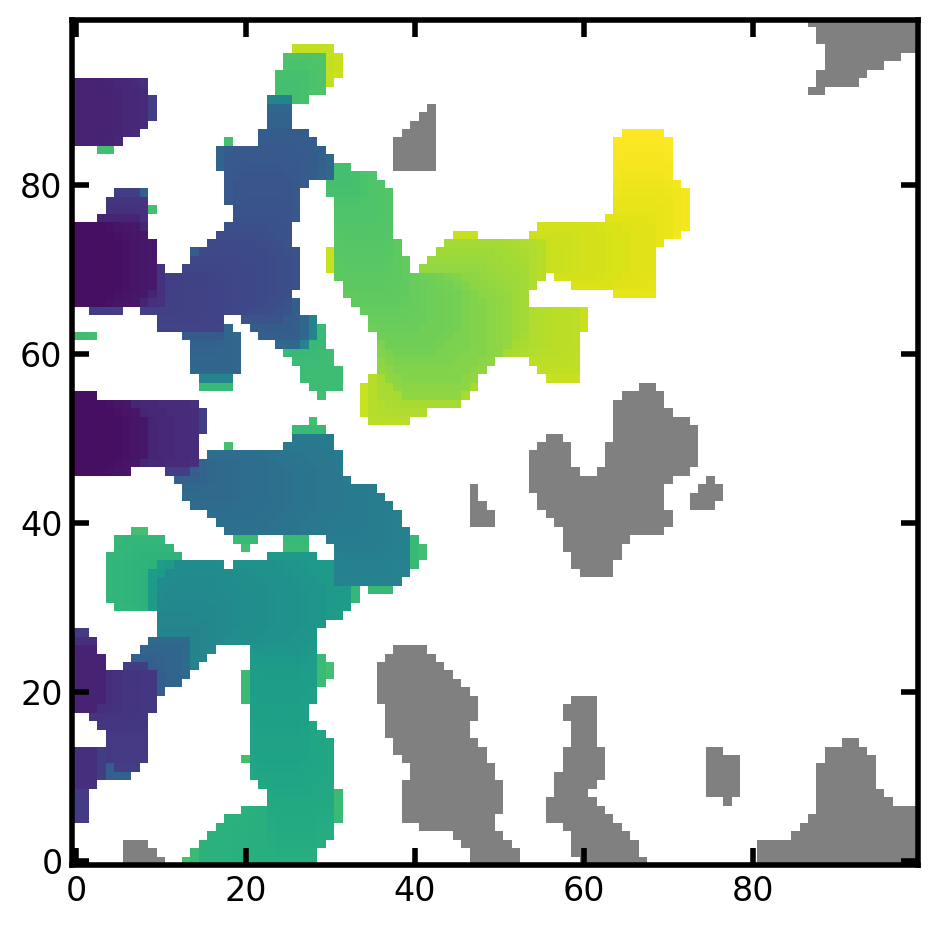
Colormap to be assigned to the highest color bound (over color) in the color map. The voxeled colored by c_overer are the solid phase. The default over color is white.
mov = ps.visualization.satn_to_movie(im=im, satn=satn, c_over="yellow")
image_based_ip_c_over = mov.to_jshtml()
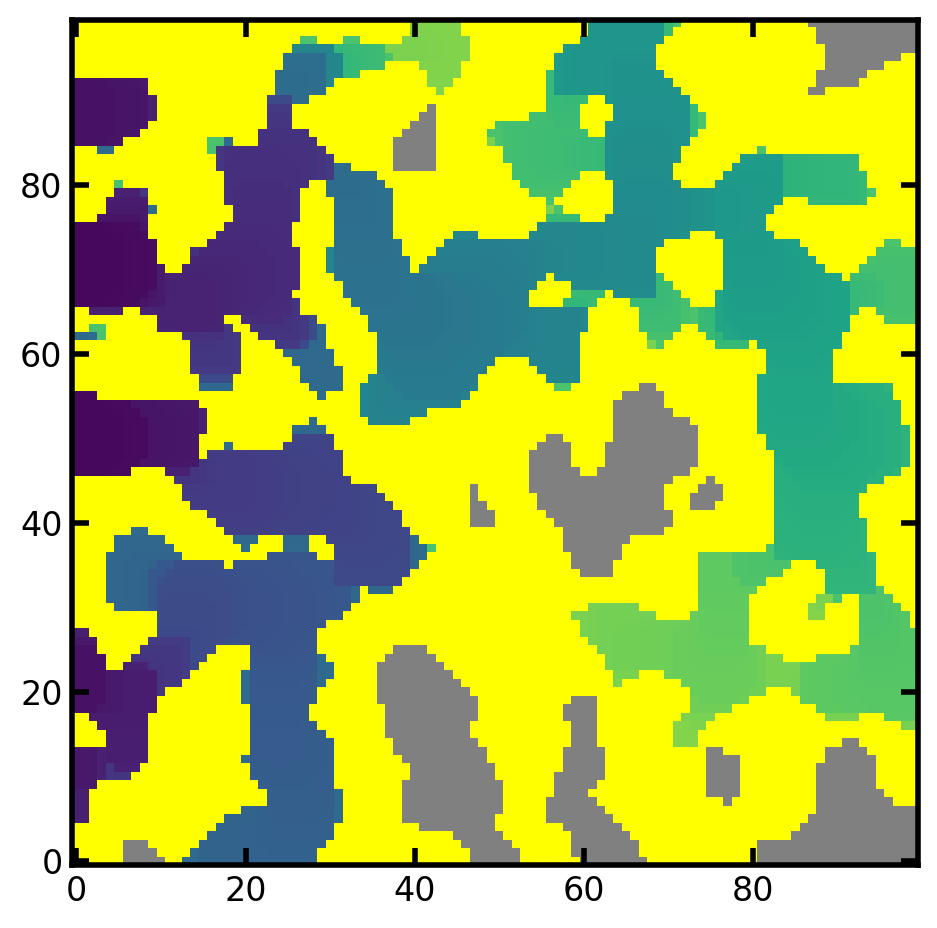
HTML(image_based_ip_c_over)
v_under#
This is the lowest bound of satn data range that the colormap covers. By default, the v_under is 0.001.
mov = ps.visualization.satn_to_movie(im=im, satn=satn, v_under=0.2)
image_based_ip_v_under = mov.to_jshtml()
HTML(image_based_ip_v_under)
v_over#
This is the highest bound of satn data range that the colormap covers. By default, the v_over is 1.
mov = ps.visualization.satn_to_movie(im=im, satn=satn, v_over=0.5)
image_based_ip_v_over = mov.to_jshtml()
0%| | 0/390 [00:00<?, ?it/s]
HTML(image_based_ip_v_over)