flood#
Floods each region with a specific value based on a specified statistical operation performed on values in that region.
Import packages#
import matplotlib.pyplot as plt
from edt import edt

import porespy as ps

ps.visualization.set_mpl_style()
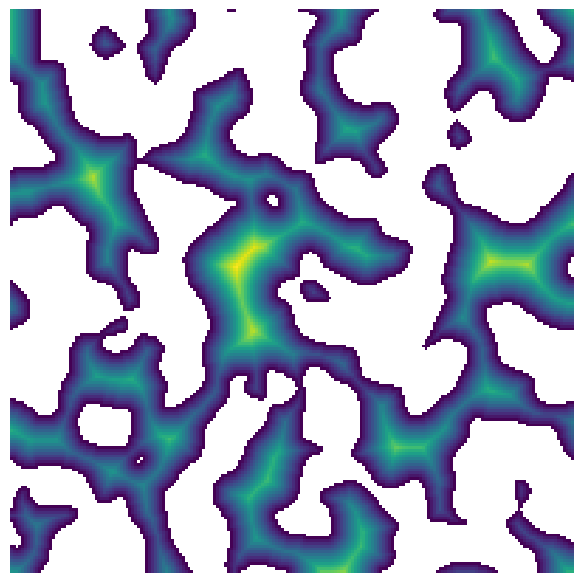
im#
The distance transform can have statistical calculations performed
im = ps.generators.blobs(shape=[200, 200])
dt = edt(im)

plt.figure(figsize=[6, 6])
plt.imshow(dt / im)
plt.axis(False);
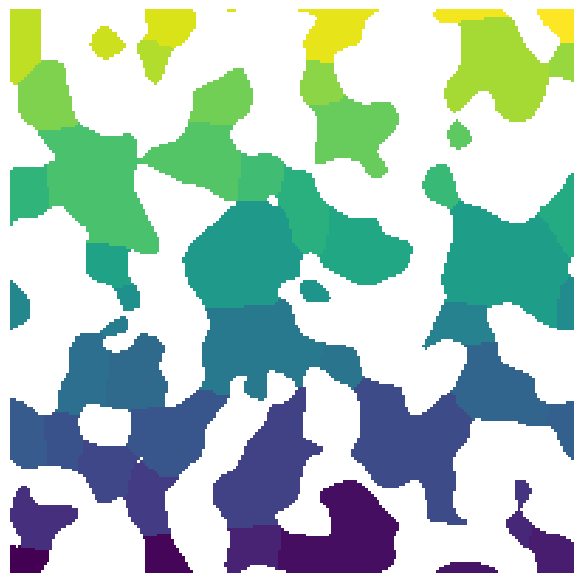
labels#
snow_partitioning can be used to create regions
regions = ps.filters.snow_partitioning(im, r_max=4, sigma=0.4)
labels = regions.regions

plt.figure(figsize=[6, 6])
plt.imshow(labels / im)
plt.axis(False);
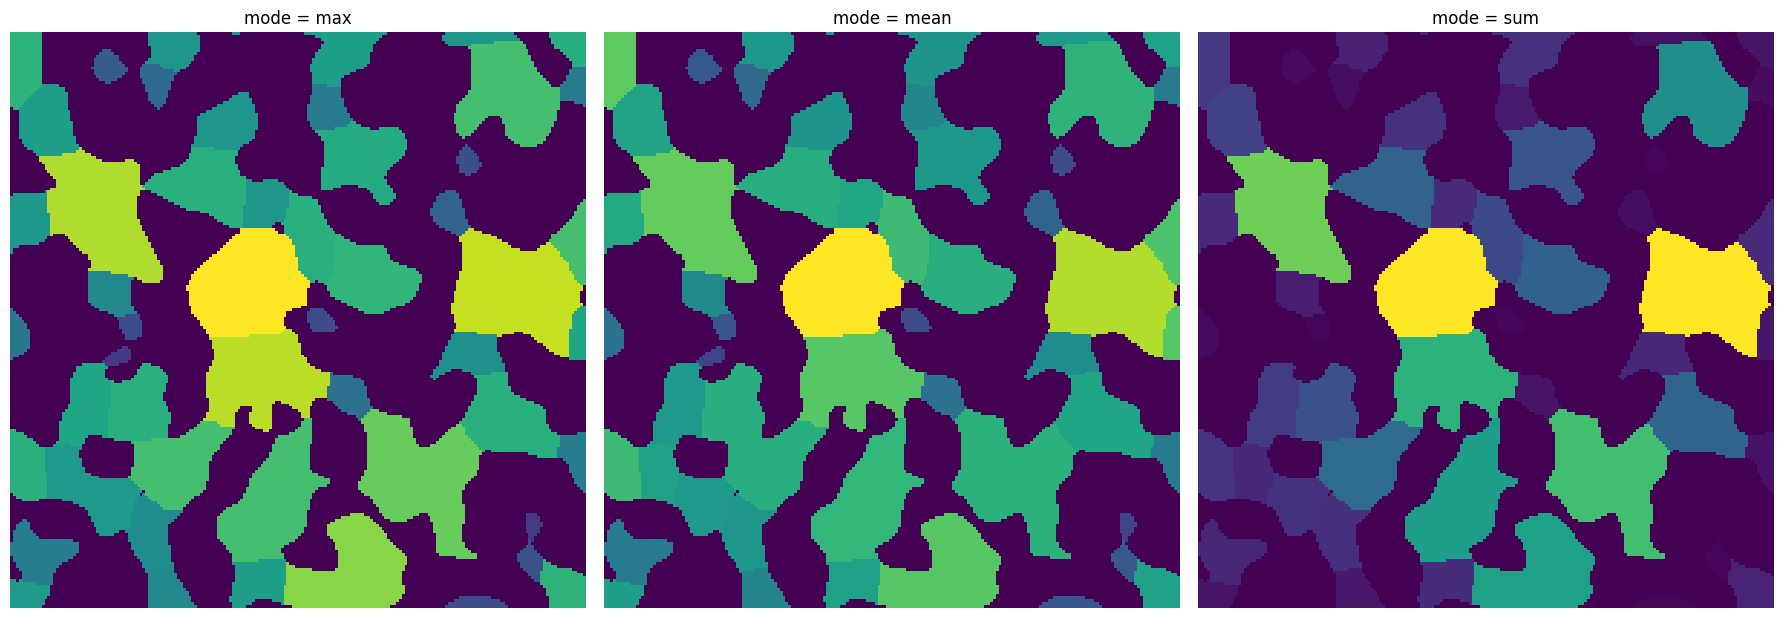
mode#
Various functions in scipy.ndimage.measurements are called to perform statistical calculation. The mode indicates which function to call.
x1 = ps.filters.flood(im=dt, labels=labels, mode="max")
x2 = ps.filters.flood(im=dt, labels=labels, mode="mean")
x3 = ps.filters.flood(im=dt, labels=labels, mode="sum")

fig, ax = plt.subplots(1, 3, figsize=[18, 18])
ax[0].imshow(x1)
ax[0].axis(False)
ax[0].set_title("mode = max")
ax[1].imshow(x2)
ax[1].axis(False)
ax[1].set_title("mode = mean")
ax[2].imshow(x3)
ax[2].axis(False)
ax[2].set_title("mode = sum");