imshow#
This is a wrapper around matplotlib’s imshow that works better with voxel images
import matplotlib.pyplot as plt

import porespy as ps

ps.visualization.set_mpl_style()
im#
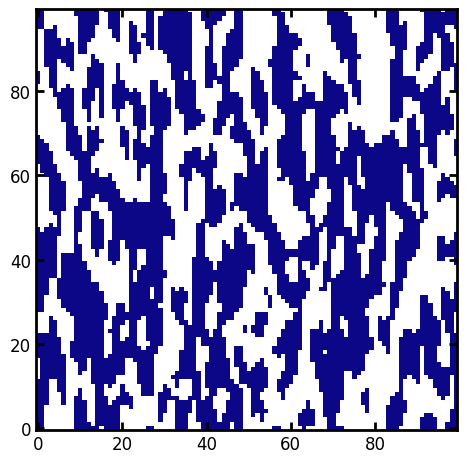
The image to show. Can be 2D or 3D:
im = ps.generators.blobs([100, 100, 100], blobiness=[1, 2, 3])
ps.visualization.imshow(im);
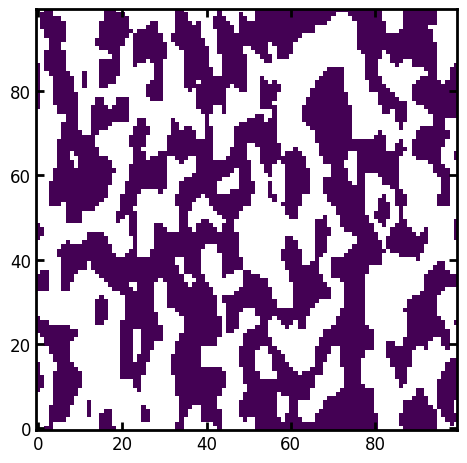
axis#
3D images must be sliced to present a 2D view. This argument controls which axis to slice along. The default is 2, which is the traditional z-axis, so the function will show an xy slice.
ps.visualization.imshow(im, axis=1);
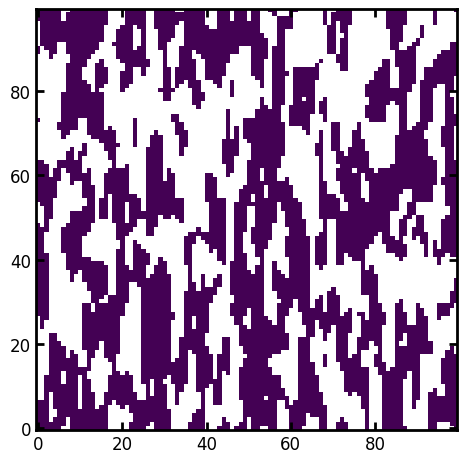
ind#
The location or index to slice at, with the default being the midpoint of the specified axis.
ps.visualization.imshow(im, axis=1, ind=10);
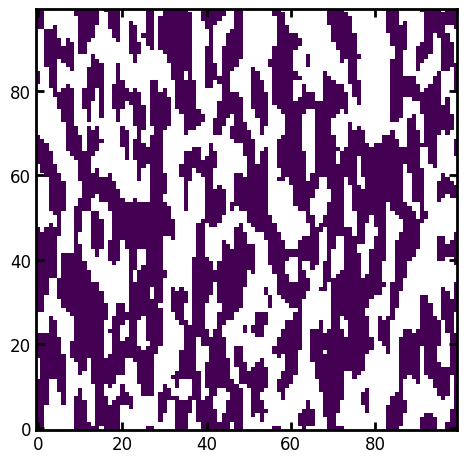
kwargs#
All other keyword arguments are passed on to plt.imshow. For instance you can set the colormap:
ps.visualization.imshow(im, axis=1, ind=10, cmap=plt.cm.plasma);