sem#
Visualize a 3D image in 2D by simulating an SEM image with infinite depth-of-field and brightness inversely corresponding to distance from top surface
import matplotlib.pyplot as plt

import porespy as ps

ps.visualization.set_mpl_style()
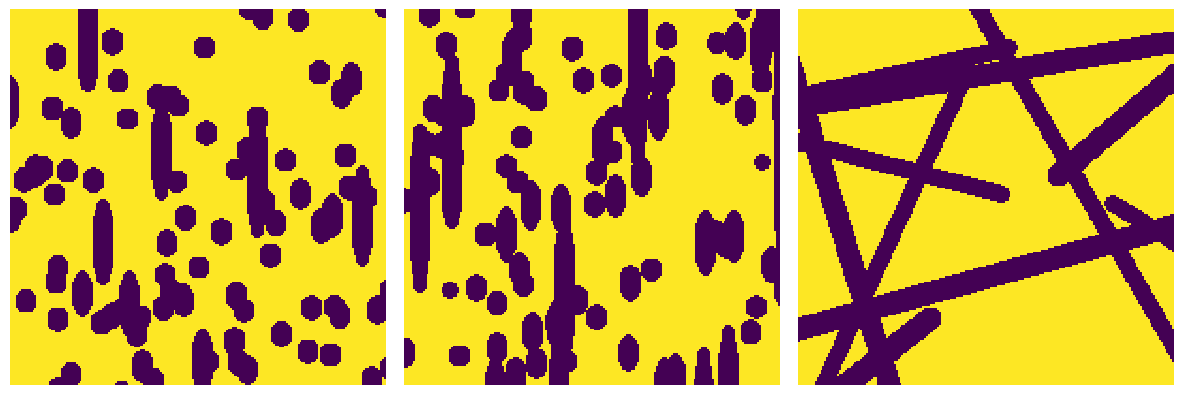
Create a test image of fibers since the orientation is useful for visualization:
im = ps.generators.cylinders(shape=[200, 200, 200], r=6, porosity=0.7)
fig, ax = plt.subplots(1, 3, figsize=[12, 8])
ax[0].imshow(im[50, :, :])
ax[0].axis(False)
ax[1].imshow(im[:, 50, :])
ax[1].axis(False)
ax[2].imshow(im[:, :, 50])
ax[2].axis(False);
axis#
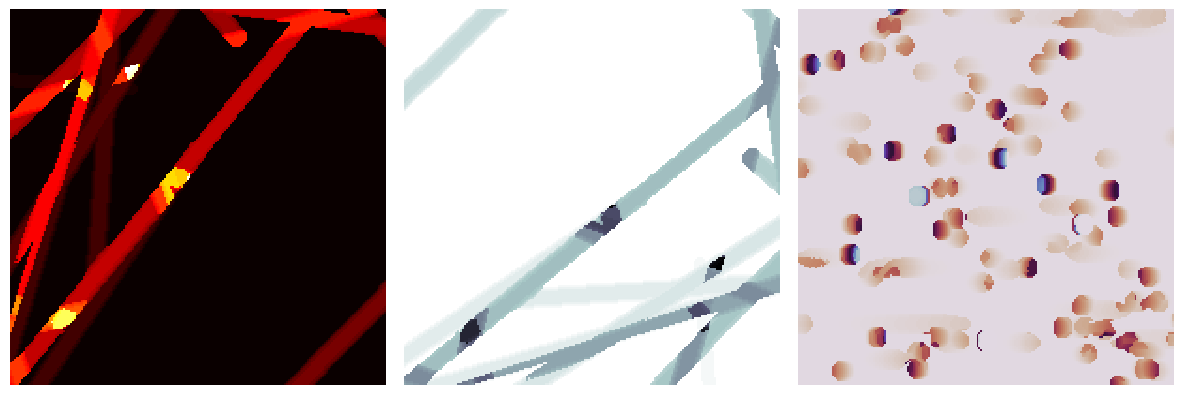
By default the image will be viewed along the x-axis, but this can be specified:
fig, ax = plt.subplots(1, 3, figsize=[12, 8])

im1 = ps.visualization.sem(im)
ax[0].imshow(im1, cmap=plt.cm.hot_r)
ax[0].axis(False)

im2 = ps.visualization.sem(im, axis=1)
ax[1].imshow(im2, cmap=plt.cm.bone)
ax[1].axis(False)

im2 = ps.visualization.sem(im, axis=2)
ax[2].imshow(im2, cmap=plt.cm.twilight)
ax[2].axis(False);