snow_partitioning_parallel#
Similar to snow_partitioning except that it performs SNOW algorithm in parallel and serial mode to save computational time and memory requirement respectively.
Import packages#
import time

import matplotlib.pyplot as plt
import numpy as np

import porespy as ps

ps.visualization.set_mpl_style()
np.random.seed(10)
im#
Works on 2D and 3D images. We use 2D here because it is easier to visualize.
im = ps.generators.blobs(shape=[800, 800])

plt.figure(figsize=[4, 4])
plt.axis(False)
plt.imshow(im);

parallel_kw#
The parallel_kw argument takes a dictionary with the following keywords: overlap, divs, and cores. First, the user supplied or default parallel_kw dictionary will be checked for available instruction on how to perform parallelization. If not provided, the settings in porespy.settings will be used to set parllelization arguments!
overlap, divs, and cores#
cores is the number of cores to use. The more cores the faster the snow_partitioning performs. If overlap is None it is estimated using porespy.tools.estimate_overlap method. The domain is divided by 2 in each direction as supplied to divs.
start = time.time()
parallel_kw = {"divs": 2, "overlap": None, "cores": 1}
x1 = ps.filters.snow_partitioning_parallel(im, r_max=5, sigma=0.4, parallel_kw=parallel_kw)
pause = time.time()
parallel_kw = {"divs": 2, "overlap": None, "cores": 4}
x2 = ps.filters.snow_partitioning_parallel(im, r_max=5, sigma=0.4, parallel_kw=parallel_kw)
stop = time.time()

print("OPERATION TIME:")
print("cores=1:", pause - start, "seconds")
print("cores=4:", stop - pause, "seconds")
OPERATION TIME:
cores=1: 4.723739147186279 seconds
cores=4: 0.4420619010925293 seconds
The snow algorithm returns several images
print(x1)
――――――――――――――――――――――――――――――――――――――――――――――――――――――――――――――――――――――――――――――
Results of snow_partitioning_parallel generated at Sun Mar  1 04:00:02 2026
――――――――――――――――――――――――――――――――――――――――――――――――――――――――――――――――――――――――――――――
im                        Array of size (800, 800)
dt                        Array of size (800, 800)
regions                   Array of size (800, 800)
――――――――――――――――――――――――――――――――――――――――――――――――――――――――――――――――――――――――――――――
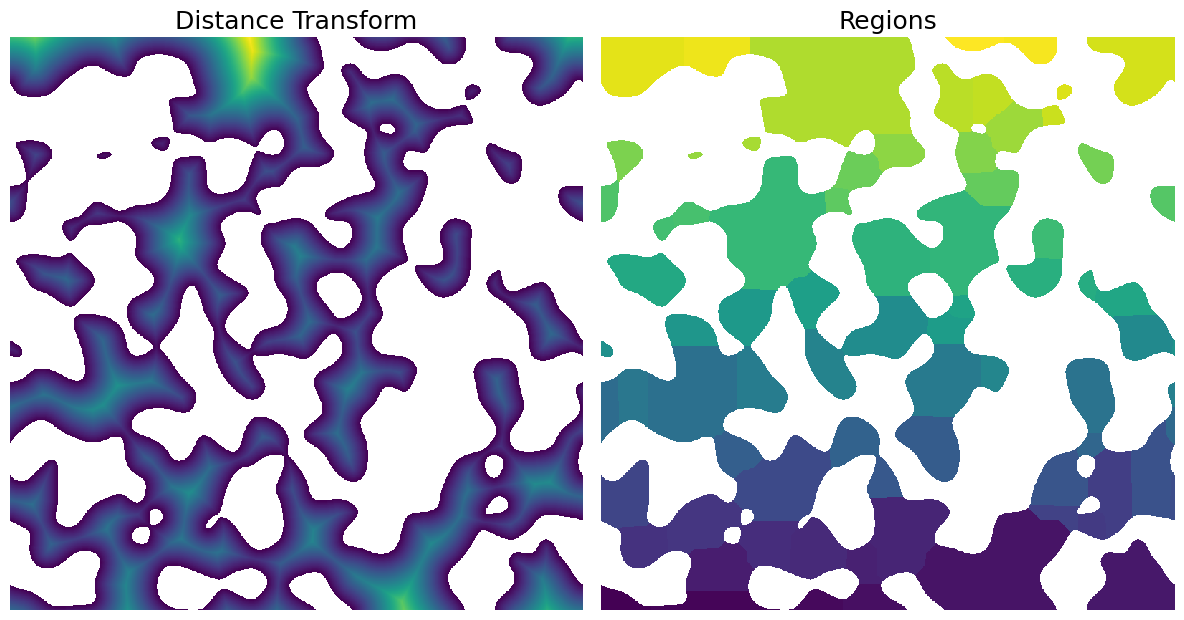
Plot the results
fix, ax = plt.subplots(1, 2, figsize=[12, 12])
ax[0].axis(False)
ax[0].imshow(x1.dt / im)
ax[0].set_title("Distance Transform", fontdict={"fontsize": 18})
ax[1].axis(False)
ax[1].imshow(x1.regions / im)
ax[1].set_title("Regions", fontdict={"fontsize": 18});