extract_regions#
Import packages#
import matplotlib.pyplot as plt
import numpy as np
import scipy.ndimage as spim

import porespy as ps

ps.visualization.set_mpl_style()
Generate image for testing#
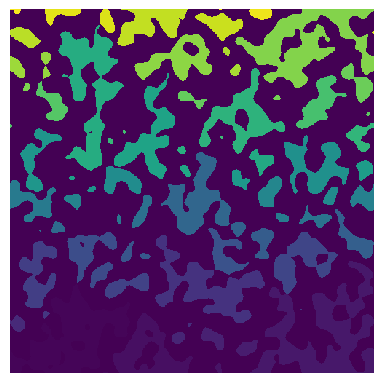
To illustrate this function, we need an image containing many labelled regions. This can obtained by generating some blobs, then using scipy.label.
np.random.seed(0)
im = ps.generators.blobs([500, 500], blobiness=2, porosity=0.4)
regions = spim.label(im)[0]
fig, ax = plt.subplots(1, 1, figsize=[4, 4])
ax.axis(False)
ax.imshow(regions);
Apply tool#
In it’s basic form, this function is equivalent to just obtaining a boolean mask like regions == 22, but it has a few more features including extracting a sub-image that just contains the regions, and also finding multiple regions at once.
reg1 = ps.tools.extract_regions(regions=regions, labels=[22], trim=False)
reg2 = ps.tools.extract_regions(regions=regions, labels=[22], trim=True)
reg3 = ps.tools.extract_regions(regions=regions, labels=[22, 23], trim=True)
fig, ax = plt.subplots(1, 3, figsize=[8, 4])
ax[0].axis(False)
ax[0].imshow(reg1)
ax[1].axis(False)
ax[1].imshow(reg2)
ax[2].axis(False)
ax[2].imshow(reg3);