show_mesh#
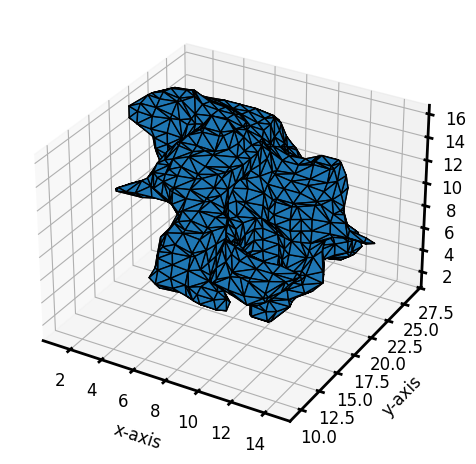
Visualizes a meshed region. This function works with taking in a meshed region and displaying the triangular mesh using Matplotlib 3D visualization.
import inspect

import numpy as np

import porespy as ps

ps.visualization.set_mpl_style()
inspect.signature(ps.visualization.show_mesh)
<Signature (mesh)>
mesh#
mesh is a tuple containing the mesh data (verts and faces) of the meshed region. This can be generated using the mesh_region function. Let’s first create a mesh for a random blob:
np.random.seed(10)
im = ps.generators.blobs(shape=[50, 50, 50])
snow = ps.filters.snow_partitioning(im)
regions = snow.regions / im
region = regions == 30
mesh = ps.tools.mesh_region(region=region)
fig = ps.visualization.show_mesh(mesh)