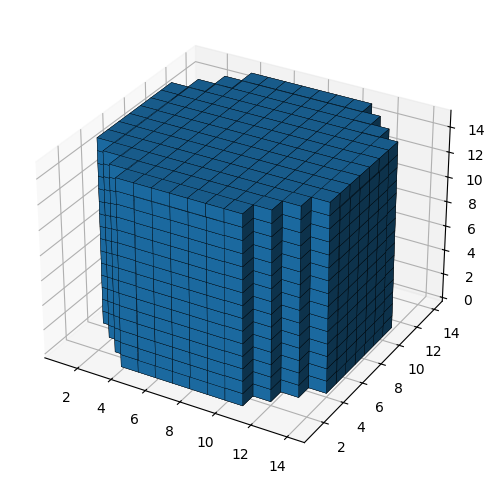
cylindrical_plug#
This creates a cylinder which can be used to define the outer regions of a tomogram.
import inspect

import matplotlib.pyplot as plt

import porespy as ps
shape#
This should be the same shape as the image which is being studied. Note that if the image does not have odd valued dimensions then the cylinder will not be centered.
im = ps.generators.blobs(shape=[15, 15, 15], porosity=0.6)
cyl = ps.generators.cylindrical_plug(shape=im.shape)

ax = plt.figure(figsize=[6, 6]).add_subplot(projection="3d")
ax.voxels(cyl, edgecolor="k", linewidth=0.25);
Or to generate a 2D disk
cyl = ps.generators.cylindrical_plug(shape=[21, 21])

plt.imshow(cyl, origin="lower", interpolation="none")
plt.axis(False);

r#
The radius of the plug. By default it will fill the image, but it can be smaller or larger than the image too.
fig, ax = plt.subplots(1, 2, figsize=[12, 6])

r = 5
cyl = ps.generators.cylindrical_plug(shape=im.shape, r=r)

ax[0].imshow(cyl[..., 10], interpolation="none", origin="lower")
ax[0].axis(False)

r = 8
cyl = ps.generators.cylindrical_plug(shape=im.shape, r=r)

ax[1].imshow(cyl[..., 10], interpolation="none", origin="lower")
ax[1].axis(False);

smooth#
This flag controls whether or not the single voxel protrusions are present on each face of the cylinder. If False the the protrusions are present but note that the cylinder extends further out, so if 2r + 1 is equal to the size of the image, then the protrusions will be lost.
r = 5
cyl1 = ps.generators.cylindrical_plug(shape=im.shape, r=r, smooth=True)
cyl2 = ps.generators.cylindrical_plug(shape=im.shape, r=r, smooth=False)

fig, ax = plt.subplots(1, 2, figsize=[8, 4])
ax[0].imshow(cyl1[..., 10], interpolation="none", origin="lower")
ax[0].axis(False)
ax[1].imshow(cyl2[..., 10], interpolation="none", origin="lower")
ax[1].axis(False);

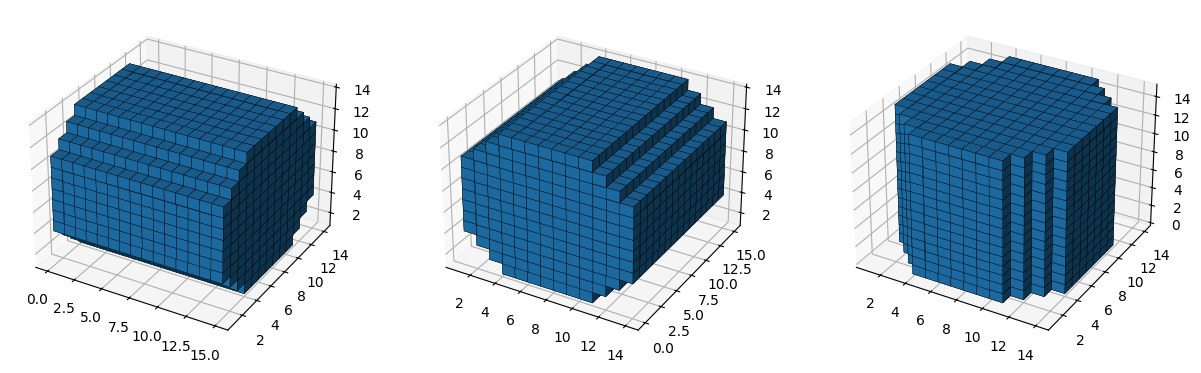
axis#
The orientation of the plug can be aligned with any axis:
fig, (ax1, ax2, ax3) = plt.subplots(ncols=3, subplot_kw={"projection": "3d"}, figsize=[15, 5])

cyl = ps.generators.cylindrical_plug(shape=im.shape, axis=0)
ax1.voxels(cyl, edgecolor="k", linewidth=0.25)

cyl = ps.generators.cylindrical_plug(shape=im.shape, axis=1)
ax2.voxels(cyl, edgecolor="k", linewidth=0.25)

cyl = ps.generators.cylindrical_plug(shape=im.shape, axis=2)
ax3.voxels(cyl, edgecolor="k", linewidth=0.25);