percolating_porosity#
This function computes the fraction of the void space which percolates along a given axis or between specified inlets and outlets.
import porespy as ps
import numpy as np
import matplotlib.pyplot as plt

ps.visualization.set_mpl_style()
im#
The image of the void space to analyze
eps = np.linspace(0.01, 0.99, 25)
perc = []
for e in eps:
    im = ps.generators.blobs([100, 100], porosity=e, seed=2)
    tmp = ps.metrics.percolating_porosity(im)
    perc.append(tmp)
fig, ax = plt.subplots(figsize=[4, 4])
ax.plot(eps, perc, "b.-")
ax.set_xlabel("Total porosity")
ax.set_ylabel("Percolating porosity");

axis vs inlets and outlets#
Since percolation is direction dependent it is necessary to specify the axis along which percolation should be checked. The default is axis=0, but this can be set to 1 or 2. Alternatively it is possible to specify inlets and outlets as a pair of boolean images with True values indicate the inlet and outlet pixels/voxels. For instance consider the following image which percolates from left to right, but not top to bottom:
im = ps.generators.blobs([100, 100], porosity=0.55, seed=5)
fig, ax = plt.subplots(figsize=[4, 4])
ax.imshow(im)
ax.axis(False);
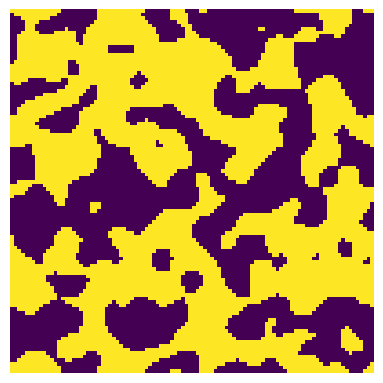
eps_0 = ps.metrics.percolating_porosity(im, axis=0)
eps_1 = ps.metrics.percolating_porosity(im, axis=1)

print(f"The percolating porosity in the x and y directions is {eps_0} and {eps_1}")
The percolating porosity in the x and y directions is 0.0 and 0.2621
conn#
The conn argument can be set to min or max and controls how pixels must be connected when looking for percolation. For min this means 4 and 8 neighbors in 2D and 3D respectively, while max means 8 and 26 for 3D.
im = ps.generators.blobs([100, 100], porosity=0.5, seed=4)
fig, ax = plt.subplots(figsize=[4, 4])
ax.imshow(im)
ax.axis(False);
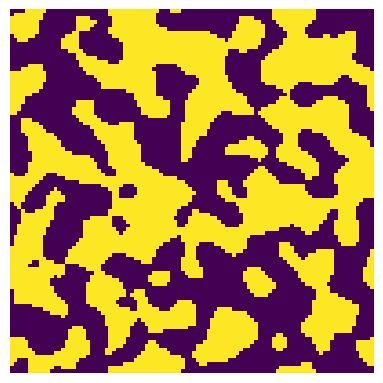
The above image has a cluster on the left side which is only connected to the percolating cluster via corners, so the percolating porosity will differ depending on the conn argument.
eps_min = ps.metrics.percolating_porosity(im, axis=1, conn="min")
eps_max = ps.metrics.percolating_porosity(im, axis=1, conn="max")

print(f"The percolating porosity in the x and y directions is {eps_min} and {eps_max}")
The percolating porosity in the x and y directions is 0.2703 and 0.3013