satn_to_seq#
Converts values of invasion saturation into sequence numbers
import matplotlib.pyplot as plt
import numpy as np

import porespy as ps

ps.visualization.set_mpl_style()
Generate an image containing invasion sizes using the drainage function:
np.random.seed(0)
im = ps.generators.blobs([200, 200], porosity=0.5)
pc = ps.filters.capillary_transform(im=im, voxel_size=1.0, g=0)
inv = ps.simulations.drainage(im=im, pc=pc)
satn#
seq = ps.filters.satn_to_seq(satn=inv.im_snwp, im=im)
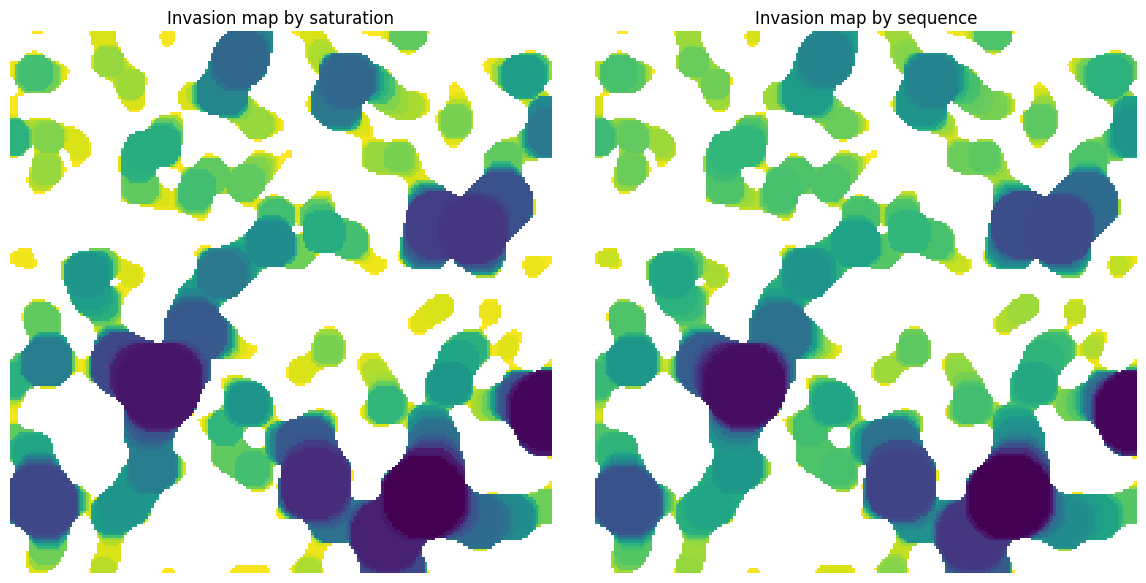
fig, ax = plt.subplots(1, 2, figsize=[12, 6])
ax[0].imshow(inv.im_snwp / im, origin="lower", interpolation="none")
ax[0].set_title("Invasion map by saturation")
ax[0].axis(False)
ax[1].imshow(seq / im, origin="lower", interpolation="none")
ax[1].set_title("Invasion map by sequence")
ax[1].axis(False);
im#
Passing the boolean image lets the function correctly determine voxels that are solid vs uninvaded, which are both labelled 0.
fig, ax = plt.subplots(1, 2, figsize=[12, 6])

ax[0].imshow(inv.im_snwp / im, origin="lower", interpolation="none")
ax[0].set_title("Invasion map by saturation")
ax[0].axis(False)

seq = ps.filters.satn_to_seq(satn=inv.im_snwp, im=im)
ax[1].imshow(seq / im, origin="lower", interpolation="none")
ax[1].set_title("Invasion map by sequence")
ax[1].axis(False);