prep_for_imshow#
This function returns a dictionary that can be passed to matplotlib’s imshow function, with all the necessary keyword arguments holding values to make the output look nice.
from copy import copy

import matplotlib.pyplot as plt
from edt import edt

import porespy as ps

ps.visualization.set_mpl_style()
import inspect

inspect.signature(ps.visualization.prep_for_imshow)
<Signature (im, mask=None, axis=0, slice=None)>
im = ps.generators.blobs([50, 50, 50], porosity=0.6)
dt = edt(im)
im#
The im is usually greyscale values, but boolean also works.
kw = ps.visualization.prep_for_imshow(im=dt, mask=im)
plt.imshow(**kw);
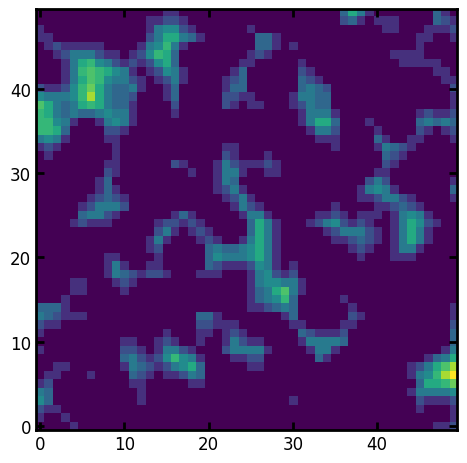
The returned dict is passable to imshow as keyword arguments, with all the useful values set
print(kw.keys())
dict_keys(['X', 'vmin', 'vmax', 'interpolation', 'origin'])
Xis the array to show. Theimwas 3D, but the function extracts a 2D slice which is necessary forimshow.vminandvmaxare minimum and maximum values inim, while any negative and positive infinities are set tovmin - 1andvmax - 1respectively. You can adjust adjust a colormap to show suitable colors for over and under values.interpolationis set tononewhich prevents artifacts, especially in boolean images.originis set tolowerso that [0, 0] is in the bottom-left where it belongs.
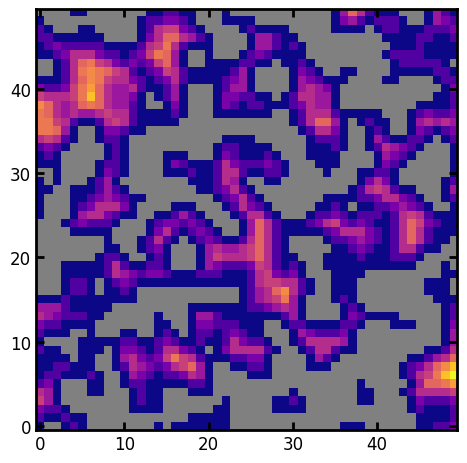
We can show the solid phase as grey, and also use the plasma colormap:
kw = ps.visualization.prep_for_imshow(im=dt, mask=im)
cmap = copy(plt.cm.plasma)
cmap.set_under("grey")
plt.imshow(**kw, cmap=cmap);
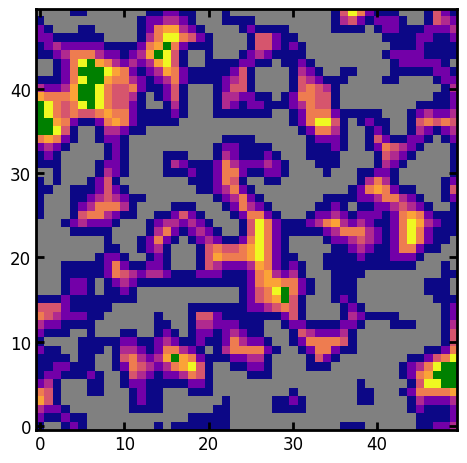
mask#
The mask is a boolean array indicating the voxels of interest when computing vmin and vmax. This would typically be the image of the pore phase, but could be something more creative:
mask = im * (dt < 3)
kw = ps.visualization.prep_for_imshow(im=dt, mask=mask)
cmap = copy(plt.cm.plasma)
cmap.set_under("grey")
cmap.set_over("green")
plt.imshow(**kw, cmap=cmap);
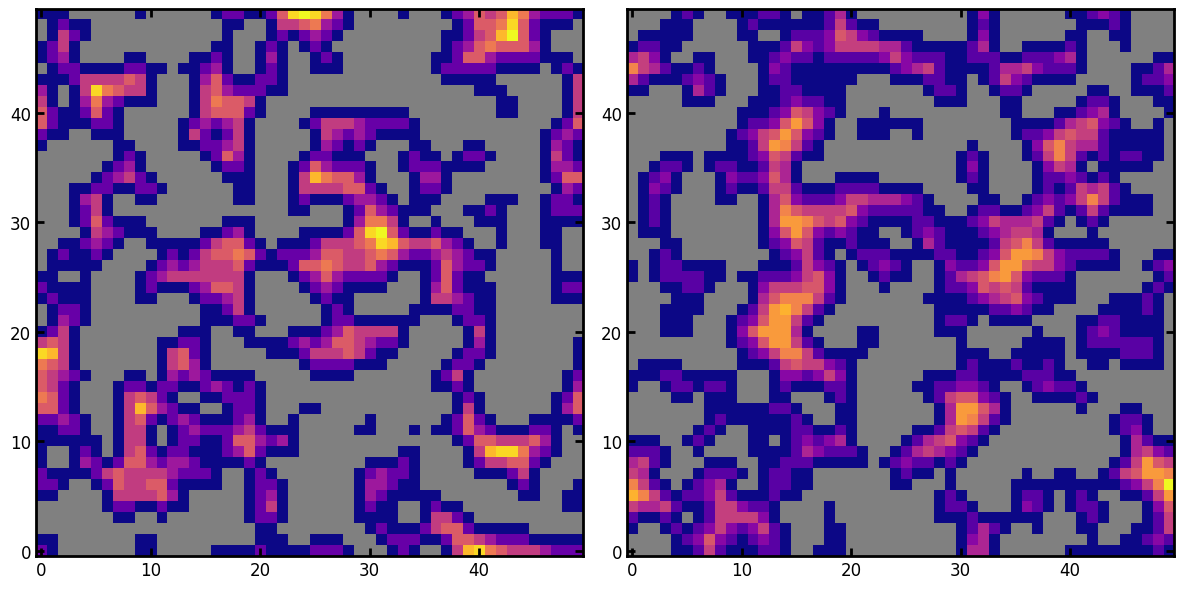
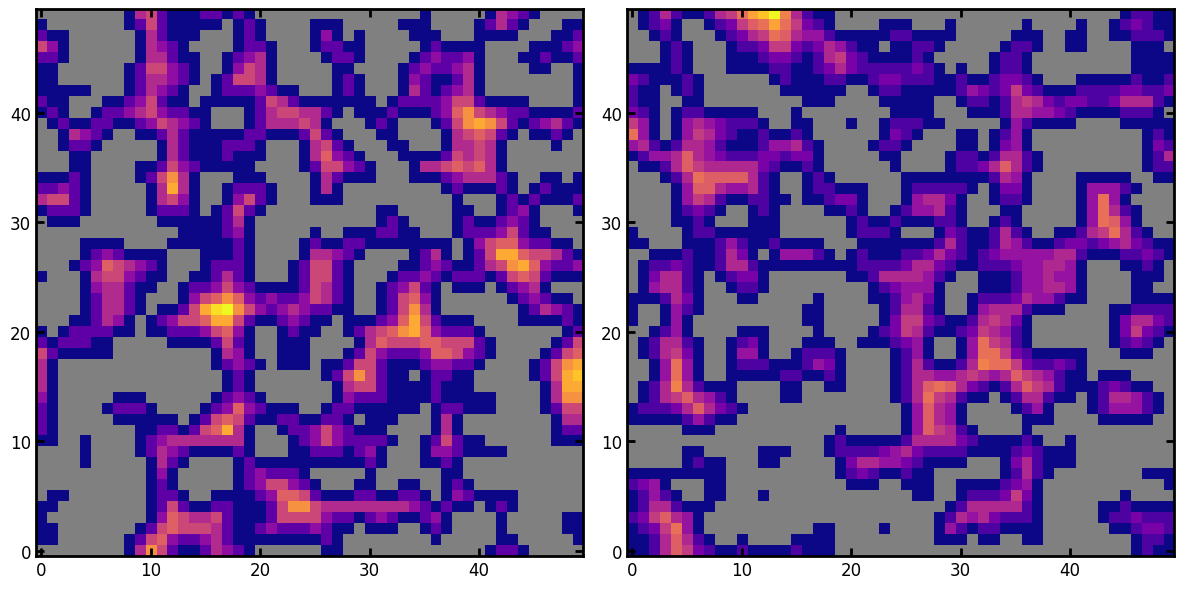
axis#
The direction normal to which the slice should be taken. The default is 0, which means a y-z slice looking in the x direction.
kw1 = ps.visualization.prep_for_imshow(im=dt, mask=im, axis=1)
kw2 = ps.visualization.prep_for_imshow(im=dt, mask=im, axis=2)

cmap = copy(plt.cm.plasma)
cmap.set_under("grey")
fig, ax = plt.subplots(1, 2, figsize=[12, 6])
ax[0].imshow(**kw1, cmap=cmap)
ax[1].imshow(**kw2, cmap=cmap);
slice#
The postion along axis where the 2D section should be taken from. If not provided (and the image is 3D) then a slice is taken from the midpoint of the given axis.
kw1 = ps.visualization.prep_for_imshow(im=dt, mask=im, slice=10)
kw2 = ps.visualization.prep_for_imshow(im=dt, mask=im, slice=20)

cmap = copy(plt.cm.plasma)
cmap.set_under("grey")
fig, ax = plt.subplots(1, 2, figsize=[12, 6])
ax[0].imshow(**kw1, cmap=cmap)
ax[1].imshow(**kw2, cmap=cmap);