representative_elementary_volume
Calculates the porosity of an image as a function subdomain size. This method works with extracting a specified number of subdomains of random size, then finding the porosity of those subdomains.
import matplotlib.pyplot as plt
import numpy as np
import porespy as ps
import inspect
inspect.signature(ps.metrics.representative_elementary_volume)
<Signature (im, npoints=1000)>
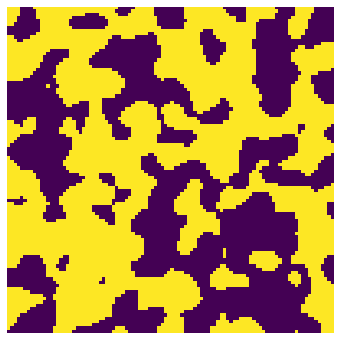
im
The input binary image of the porous material with void space voxels labeled with 1(True) and solid phase labeled with 0(False).
np.random.seed(10)
im = ps.generators.blobs(shape=[100,100, 100])
fig, ax = plt.subplots(1, 1, figsize=[6, 6])
ax.imshow(im[:,:,6], origin='lower', interpolation='none')
ax.axis(False);
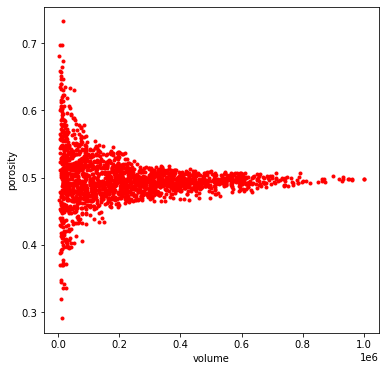
The representative_elementary_volume returns a custom object containing the volume and porosity data. We can then plot the data to find the representative elementary volume (REV) of the porous material. REV can be found as the volume of a subdomain where any larger subdomain will have almost similar porosity values. In other words, in the following plot the point where the variation of porosity vs volume becomes a plateau.
profile = ps.metrics.representative_elementary_volume(im=im)
fig, ax = plt.subplots(1, 1, figsize=[6, 6])
ax.plot(profile.volume, profile.porosity, 'r.')
ax.set_xlabel("volume")
ax.set_ylabel("porosity");
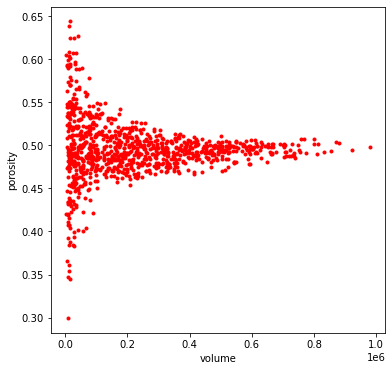
npoints
By default the method uses 1000 randomly located and sized boxes to sample as subdomains. Let’s try a higher number to increase the number of samples:
profile = ps.metrics.representative_elementary_volume(im=im, npoints=2000)
fig, ax = plt.subplots(1, 1, figsize=[6, 6])
ax.plot(profile.volume, profile.porosity, 'r.')
ax.set_xlabel("volume")
ax.set_ylabel("porosity");