borders#
Generate borders around an image
import inspect

import matplotlib.pyplot as plt

import porespy as ps

inspect.signature(ps.generators.borders)
<Signature (shape, thickness: int = 1, mode: Literal['edges', 'faces', 'corners'] = 'edges')>
shape#
Will typically be the shape of another image, which can be 2D or 3D:
im = ps.generators.blobs([20, 20], porosity=0.6)
bd = ps.generators.borders(shape=im.shape)

fig, ax = plt.subplots(1, 1, figsize=[6, 6])
ax.imshow(bd, interpolation="none")
ax.axis(False);

thickness#
Controls the thickness of the border:
im = ps.generators.blobs([20, 20], porosity=0.6)
bd = ps.generators.borders(shape=im.shape, thickness=3)

fig, ax = plt.subplots(1, 1, figsize=[6, 6])
ax.imshow(bd, interpolation="none")
ax.axis(False);

mode#
The type of borders to generate, with options being corners, edges and faces. In 2D edges and faces are the same.
fig, ax = plt.subplots(1, 3, figsize=[12, 6])

bd = ps.generators.borders(shape=im.shape, thickness=3, mode="faces")
ax[0].imshow(bd, interpolation="none")
ax[0].axis(False)

bd = ps.generators.borders(shape=im.shape, thickness=3, mode="edges")
ax[1].imshow(bd, interpolation="none")
ax[1].axis(False)

bd = ps.generators.borders(shape=im.shape, thickness=3, mode="corners")
ax[2].imshow(bd, interpolation="none")
ax[2].axis(False);

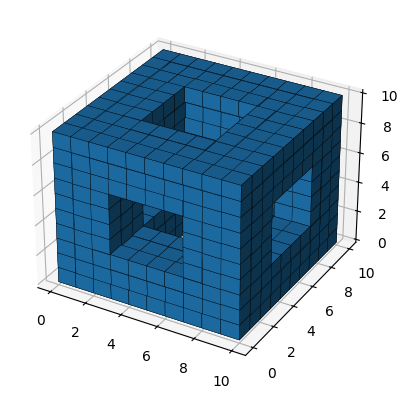
im = ps.generators.blobs(shape=[10, 10, 10], porosity=0.6)
bd = ps.generators.borders(shape=im.shape, thickness=3, mode="edges")
ax = plt.figure().add_subplot(projection="3d")
ax.voxels(bd, edgecolor="k", linewidth=0.25);
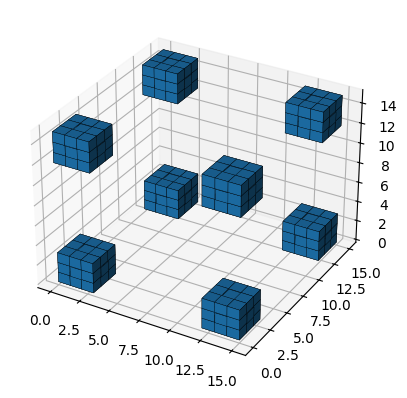
im = ps.generators.blobs(shape=[15, 15, 15], porosity=0.6)
bd = ps.generators.borders(shape=im.shape, thickness=3, mode="corners")
ax = plt.figure().add_subplot(projection="3d")
ax.voxels(bd, edgecolor="k", linewidth=0.25);