cylindrical_pillars_array#
Generates an array of cylindrical pillars with a specified pillar size distribution.
import matplotlib.pyplot as plt
import numpy as np

import porespy as ps
from porespy.visualization import set_mpl_style

set_mpl_style()
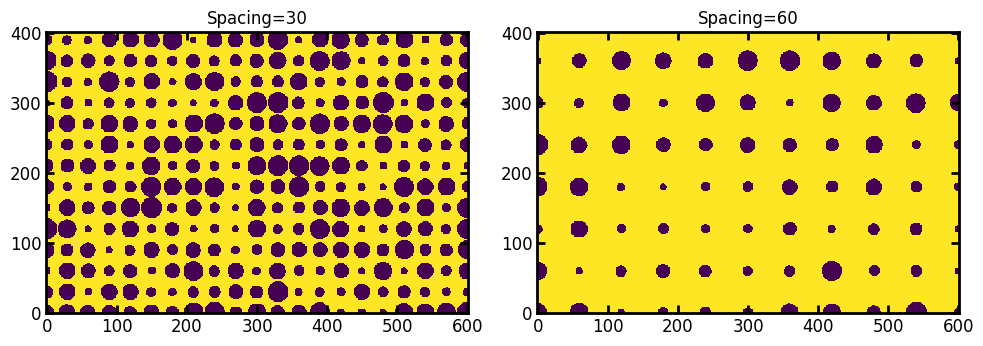
spacing#
Controls the spacing between the pore centers.
fig, ax = plt.subplots(1, 2, figsize=(10, 5))
np.random.seed(0)
im1 = ps.generators.cylindrical_pillars_array(shape=[401, 601], spacing=30)
im2 = ps.generators.cylindrical_pillars_array(shape=[401, 601], spacing=60)

ax[0].imshow(im1, origin="lower", interpolation="none")
ax[0].set_title("Spacing=30")
ax[1].imshow(im2, origin="lower", interpolation="none")
ax[1].set_title("Spacing=60");
lattice#
The type of lattice to use, options are 'simple' and 'triangular'
fig, ax = plt.subplots(1, 2, figsize=(10, 5))
np.random.seed(0)
im1 = ps.generators.cylindrical_pillars_array(
    shape=[401, 601],
    spacing=70,
    lattice="simple",
)
im2 = ps.generators.cylindrical_pillars_array(
    shape=[401, 601],
    spacing=70,
    lattice="triangular",
)

ax[0].imshow(im1, origin="lower", interpolation="none")
ax[0].set_title("Simple Cubic Lattice")
ax[1].imshow(im2, origin="lower", interpolation="none")
ax[1].set_title("Triangular Lattice");

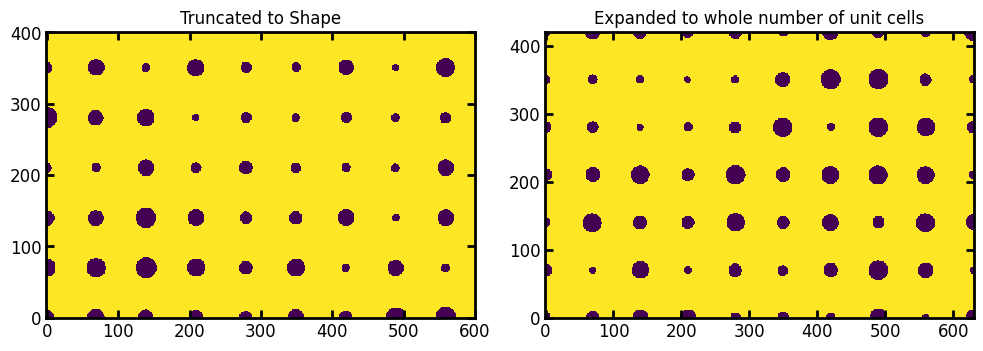
truncate#
If True it returns the array within an image of the specified size (i.e. it truncates the full pattern). If False it returns an image that is larger than the requested shape but contains a whole number of unit cells.
fig, ax = plt.subplots(1, 2, figsize=(10, 5))
np.random.seed(0)
im1 = ps.generators.cylindrical_pillars_array(
    shape=[401, 601],
    spacing=70,
    lattice="simple",
    truncate=True,
)
im2 = ps.generators.cylindrical_pillars_array(
    shape=[401, 601],
    spacing=70,
    lattice="simple",
    truncate=False,
)

ax[0].imshow(im1, origin="lower", interpolation="none")
ax[0].set_title("Truncated to Shape")
ax[1].imshow(im2, origin="lower", interpolation="none")
ax[1].set_title("Expanded to whole number of unit cells");
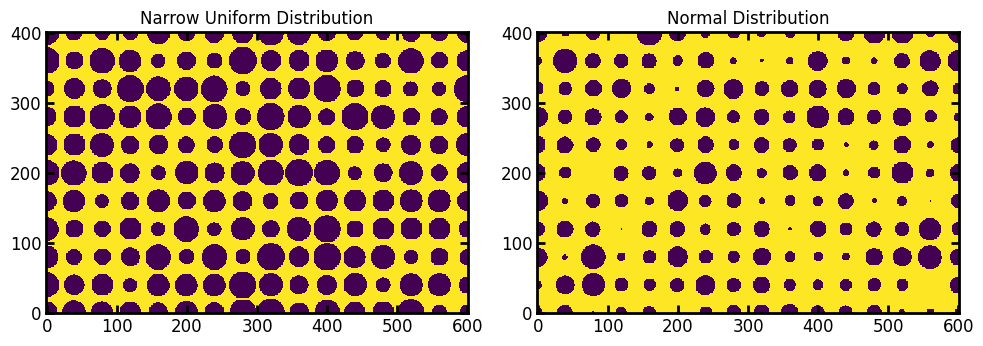
dist and dist_kwargs#
Allows for full control over the distribution of the opening size between pillars. The default is a uniform distribution with sizes ranging from 5 to 15, but any distribution from scipy.stats can be used:
fig, ax = plt.subplots(1, 2, figsize=(10, 5))
np.random.seed(0)
im1 = ps.generators.cylindrical_pillars_array(
    shape=[401, 601],
    dist="uniform",
    dist_kwargs=dict(loc=10, scale=10),
)
im2 = ps.generators.cylindrical_pillars_array(
    shape=[401, 601],
    dist="norm",
    dist_kwargs=dict(loc=10, scale=4),
)

ax[0].imshow(im1, origin="lower", interpolation="none")
ax[0].set_title("Narrow Uniform Distribution")
ax[1].imshow(im2, origin="lower", interpolation="none")
ax[1].set_title("Normal Distribution");
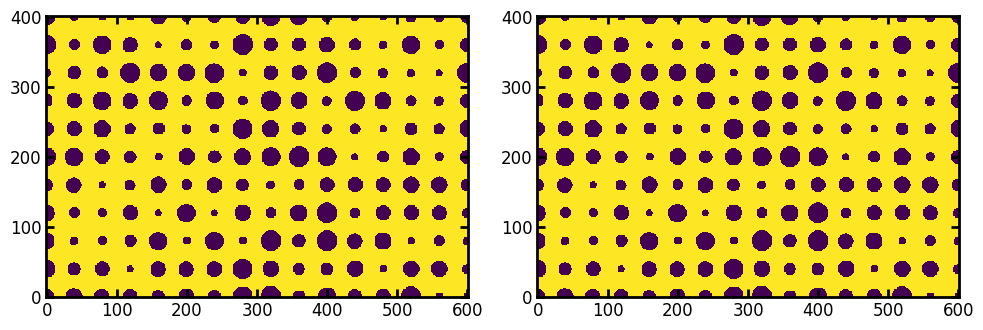
seed#
Initializes the random number generator at a specified state so that identical realizations can be obtained if desired:
fig, ax = plt.subplots(1, 2, figsize=(10, 5))
np.random.seed(0)
im1 = ps.generators.cylindrical_pillars_array(
    shape=[401, 601],
    seed=0,
)
im2 = ps.generators.cylindrical_pillars_array(
    shape=[401, 601],
    seed=0,
)

ax[0].imshow(im1, origin="lower", interpolation="none")
ax[1].imshow(im2, origin="lower", interpolation="none");