ramp#
ramp is a simple function which creates a linear ramp of values along a given axis. This function is useful for “detrending” a diffusion simulation, or for computing the elevation of each voxel in an image for including gravity effects in invasion simulations.
import matplotlib.pyplot as plt

import porespy as ps

ps.visualization.set_mpl_style()
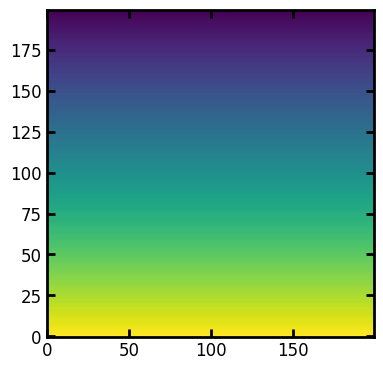
shape#
Both 2D and 3D images can be generated. Since this function is typically used in conjunction with some other image, then shape=other_im.shape would be a common option.
shape = [200, 200]
im = ps.generators.ramp(shape=shape, inlet=1, outlet=0)
fig, ax = plt.subplots(1, 1, figsize=[4, 4])
ax.imshow(im, origin="lower", interpolation="none");
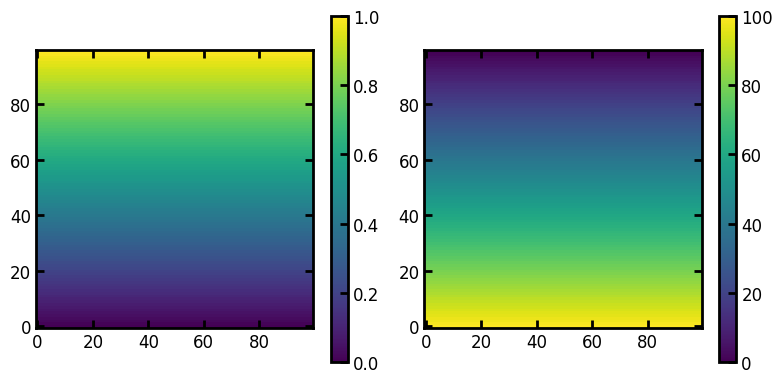
inlet and outlet#
These arguments specific the inlet and outlet values. The inlet values will be stored at the start of the specified axis, and outlet values at the end.
fig, ax = plt.subplots(1, 2, figsize=[8, 4])
h0 = ax[0].imshow(ps.generators.ramp([100, 100], inlet=0, outlet=1), origin="lower")
plt.colorbar(h0)
h1 = ax[1].imshow(ps.generators.ramp([100, 100], inlet=100, outlet=0), origin="lower")
plt.colorbar(h1);
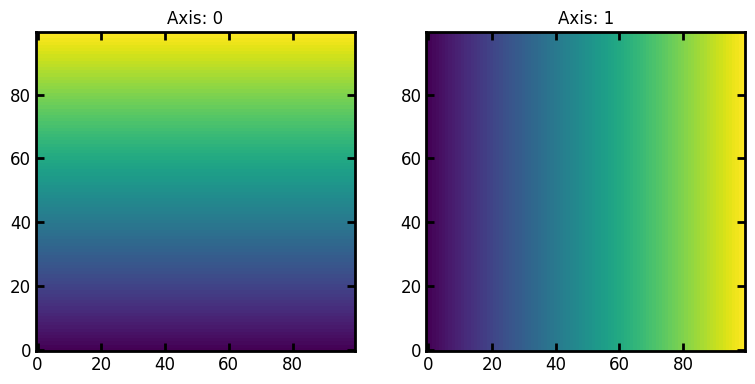
axis#
The direction of the ramp can be controlled by change which axis is used:
fig, ax = plt.subplots(1, 2, figsize=[8, 4])
axis = 0
ax[0].imshow(ps.generators.ramp([100, 100], inlet=0, outlet=1, axis=axis), origin="lower")
ax[0].set_title(f"Axis: {axis}")

axis = 1
ax[1].imshow(ps.generators.ramp([100, 100], inlet=0, outlet=1, axis=1), origin="lower")
ax[1].set_title(f"Axis: {axis}");