find_porosity_threshold#
This function dilates the solid phase iteratively until the void space no longer percolates. The percolating porosity is used in a popular tortuosity correlation by Tomadakis and Sotirichos [1]:
import porespy as ps
import matplotlib.pyplot as plt

ps.visualization.set_mpl_style()
im#
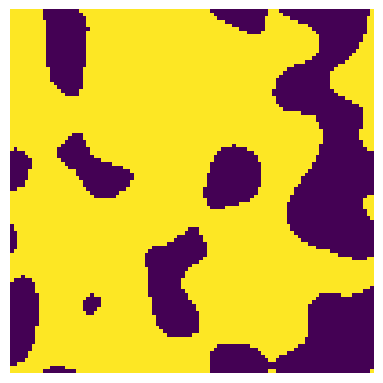
im = ps.generators.blobs([100, 100], porosity=0.7, blobiness=0.5, seed=1)

fig, ax = plt.subplots(figsize=[4, 4])
ax.imshow(im)
ax.axis(False);
r = ps.metrics.find_porosity_threshold(im)
print(r)
――――――――――――――――――――――――――――――――――――――――――――――――――――――――――――――――――――――――――――――
Results of find_porosity_threshold generated at Sun Mar  1 04:01:57 2026
――――――――――――――――――――――――――――――――――――――――――――――――――――――――――――――――――――――――――――――
eps_orig                  0.7
eps_orig_perc             0.6771
eps_thresh                0.2843
eps_thresh_perc           0.2179
eps_thresh_post           0.23
R                         7
――――――――――――――――――――――――――――――――――――――――――――――――――――――――――――――――――――――――――――――
The function returns a Results object with several attributes. eps_orig is the original porosity of im while eps_orig_perc is the fraction of the original porosity that percolates between the inlet and outlet faces (which default to the x=0 and x=-1 faces). eps_thresh is the total porosity of the image at the percolation threshold, meaning that if the solid were dilated one more time that the image would no longer percolate. eps_thresh_perc is the fraction of the void space at the percolation threshold which is connected to the percolating cluster(s).
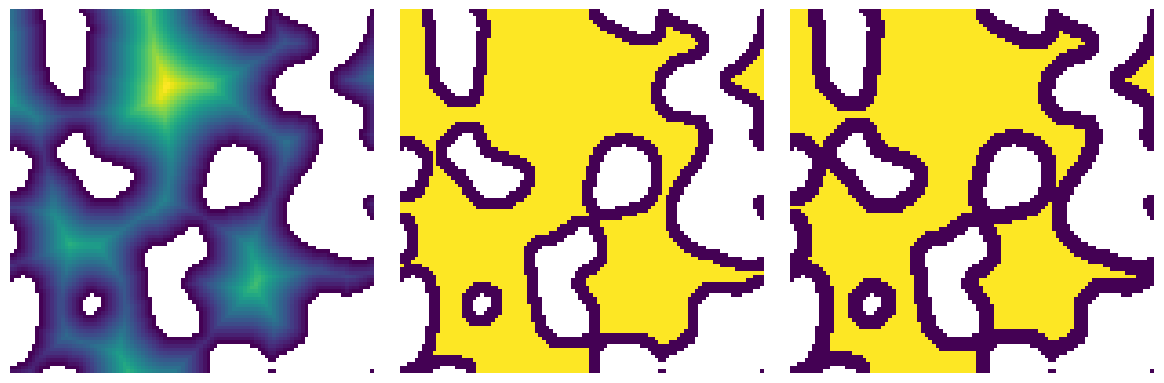
Lastly, R is for reproducing the percolating image. This is possible since the dilation is done by thresholding the distance transform of the void space. For instance:
edt = ps.tools.get_edt()
dt = edt(im)

fig, ax = plt.subplots(1, 3, figsize=[12, 4])
ax[0].imshow(dt / im)
ax[0].axis(False)
ax[1].imshow((dt >= r.R) / im)
ax[1].axis(False)
ax[2].imshow((dt >= (r.R + 1)) / im)
ax[2].axis(False);

‘axis’#
Percolation is a direction dependent phenomena. By default the function considers the x-direction, but this can be specified:
r = ps.metrics.find_porosity_threshold(im, axis=1)
print(r)
――――――――――――――――――――――――――――――――――――――――――――――――――――――――――――――――――――――――――――――
Results of find_porosity_threshold generated at Sun Mar  1 04:01:58 2026
――――――――――――――――――――――――――――――――――――――――――――――――――――――――――――――――――――――――――――――
eps_orig                  0.7
eps_orig_perc             0.6771
eps_thresh                0.4754
eps_thresh_perc           0.4693
eps_thresh_post           0.4148
R                         4
――――――――――――――――――――――――――――――――――――――――――――――――――――――――――――――――――――――――――――――
Percolation is reached in the y-direction sooner due to the relatively small opening on the right hand side which closes at R==4.
fig, ax = plt.subplots(1, 3, figsize=[12, 4])
ax[0].imshow(dt / im)
ax[0].axis(False)
ax[1].imshow((dt >= r.R) / im)
ax[1].axis(False)
ax[2].imshow((dt >= (r.R + 1)) / im)
ax[2].axis(False);
conn#
The connectivity of the pixels/voxels can also be specified as either min or max, meaning 4 or 8 neighbors in 2D, and 6 or 26 in 3D.