two_point_correlation#
Calculates the two-point correlation function using Fourier transforms.
import matplotlib.pyplot as plt
import numpy as np
import porespy as ps

ps.visualization.set_mpl_style()
im#
The input binary image of the porous material with void space voxels labeled with 1(True) and solid phase labeled with 0(False).
np.random.seed(10)
im = ps.generators.blobs(shape=[100, 100, 100])

fig, ax = plt.subplots(1, 1, figsize=[4, 4])
ax.imshow(im[:, :, 6], origin="lower", interpolation="none")
ax.axis(False);

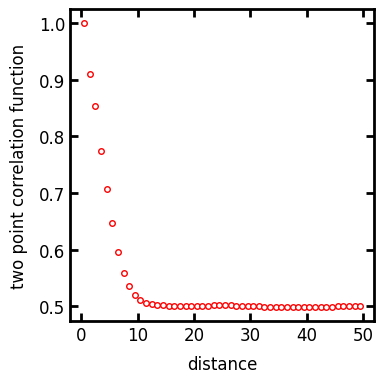
The two_point_correlation returns a custom object containing the distance and probability data. We can then plot the two point correlation function:
data = ps.metrics.two_point_correlation(im)

fig, ax = plt.subplots(1, 1, figsize=[4, 4])
ax.plot(data.distance, data.probability, "r.")
ax.set_xlabel("distance")
ax.set_ylabel("two point correlation function");