lattice_spheres#
Generates a cubic packing of spheres in a specified lattice arrangement.
import matplotlib.pyplot as plt
import porespy as ps
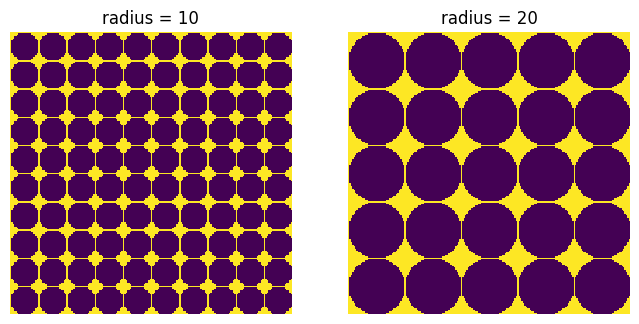
radius#
Controls the size of the spheres.
fig, ax = plt.subplots(1, 2, figsize=[8, 4])

shape = [200, 200]
r = 10
im1 = ps.generators.lattice_spheres(shape=shape, r=r)
ax[0].imshow(im1, interpolation="none")
ax[0].axis(False)
ax[0].set_title(f"radius = {r}")

r = 20
im2 = ps.generators.lattice_spheres(shape=shape, r=r)
ax[1].imshow(im2, interpolation="none")
ax[1].axis(False)
ax[1].set_title(f"radius = {r}");
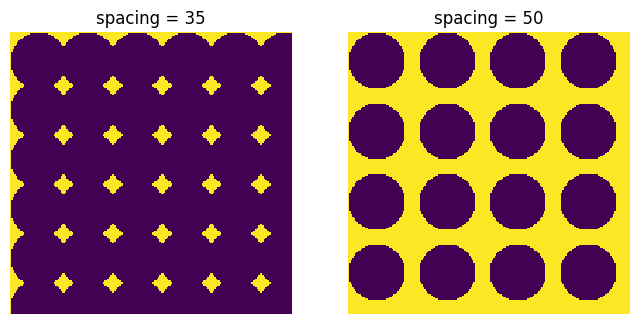
spacing#
The center-to-center spacing between the spheres. If this value is less than the sphere diamter then the spheres will overlap.
fig, ax = plt.subplots(1, 2, figsize=[8, 4])

s = 35
im1 = ps.generators.lattice_spheres(shape=shape, r=r, spacing=s)
ax[0].imshow(im1, interpolation="none")
ax[0].axis(False)
ax[0].set_title(f"spacing = {s}")


s = 50
im2 = ps.generators.lattice_spheres(shape=shape, r=r, spacing=s)
ax[1].imshow(im2, interpolation="none")
ax[1].axis(False)
ax[1].set_title(f"spacing = {s}");
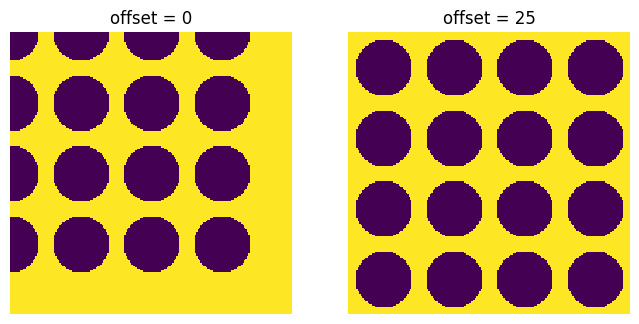
offset#
Controls how far away from the edge the first sphere is located. The default is the sphere radius but it can be more or less depending on the desired effect:
fig, ax = plt.subplots(1, 2, figsize=[8, 4])

o = 0
im1 = ps.generators.lattice_spheres(shape=shape, r=r, spacing=s, offset=o)
ax[0].imshow(im1, interpolation="none")
ax[0].axis(False)
ax[0].set_title(f"offset = {o}")

o = 25
im2 = ps.generators.lattice_spheres(shape=shape, r=r, spacing=s, offset=o)
ax[1].imshow(im2, interpolation="none")
ax[1].axis(False)
ax[1].set_title(f"offset = {o}");
lattice#
Controls the arrange of spheres. In 2D the options are simple cubic (‘sc’) and triangular (‘tri’). Note that the offset and spacing apply to the outer spheres when lattice='tri'.
fig, ax = plt.subplots(1, 2, figsize=[8, 4])

L = "sc"
r = 10
im1 = ps.generators.lattice_spheres(shape=shape, r=r, spacing=s, offset=o, lattice=L)

ax[0].imshow(im1, interpolation="none")
ax[0].axis(False)
ax[0].set_title(f"lattice = {L}")

L = "tri"
im2 = ps.generators.lattice_spheres(shape=shape, r=r, spacing=s, offset=o, lattice=L)

ax[1].imshow(im2, interpolation="none")
ax[1].axis(False)
ax[1].set_title(f"lattice = {L}");

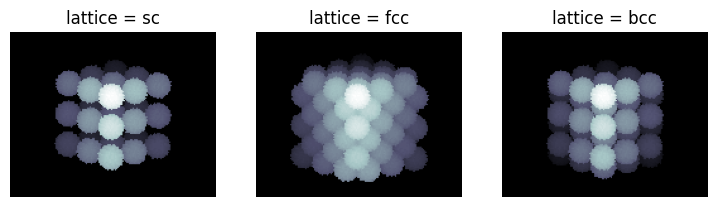
In 3D the options are simple cubic (‘sc’), face centered cubic (‘fcc’), and body centered cubic (‘bcc’). It’s more difficult to visualize in 3D but PoreSpy has a basic function called “show_3D” that works if the image is small:
fig, ax = plt.subplots(1, 3, figsize=[9, 3])

r = 10
s = 25
shape = [100, 100, 100]
L = "sc"
im1 = ps.generators.lattice_spheres(shape=shape, r=r, spacing=s, offset=o, lattice=L)
ax[0].imshow(ps.visualization.show_3D(im1), cmap=plt.cm.bone)
ax[0].axis(False)
ax[0].set_title(f"lattice = {L}")

L = "fcc"
im2 = ps.generators.lattice_spheres(shape=shape, r=r, spacing=s, offset=o, lattice=L)
ax[1].imshow(ps.visualization.show_3D(im2), cmap=plt.cm.bone)
ax[1].axis(False)
ax[1].set_title(f"lattice = {L}")

L = "bcc"
im3 = ps.generators.lattice_spheres(shape=shape, r=r, spacing=s, offset=o, lattice=L)
ax[2].imshow(ps.visualization.show_3D(im3), cmap=plt.cm.bone)
ax[2].axis(False)
ax[2].set_title(f"lattice = {L}");