cylindrical_pillars_mesh#
Generates an array of cylindrical pillars by putting a cylinder at each vertext in a triangular mesh of the domain, so has some randomness while still being quite uniform.
import matplotlib.pyplot as plt
import numpy as np

import porespy as ps
from porespy.visualization import set_mpl_style

set_mpl_style()
a#
Controls the number of pillars to add. This number tells the mesher the area of each triangle, so a smaller value of a results in more pillars.
fig, ax = plt.subplots(1, 2, figsize=(10, 5))
np.random.seed(0)
im1 = ps.generators.cylindrical_pillars_mesh(
    shape=[401, 601],
    a=500,
)
im2 = ps.generators.cylindrical_pillars_mesh(
    shape=[401, 601],
    a=5000,
)

ax[0].imshow(im1, origin="lower", interpolation="none")
ax[0].set_title("a=500")
ax[1].imshow(im2, origin="lower", interpolation="none")
ax[1].set_title("a=5000");
---------------------------------------------------------------------------
ModuleNotFoundError                       Traceback (most recent call last)
File ~/work/porespy/porespy/src/porespy/generators/_micromodels.py:295, in cylindrical_pillars_mesh(shape, f, a, n, truncate)
    294 try:
--> 295     from nanomesh import Mesher2D
    296 except ModuleNotFoundError:

ModuleNotFoundError: No module named 'nanomesh'

During handling of the above exception, another exception occurred:

ModuleNotFoundError                       Traceback (most recent call last)
Cell In[2], line 3
      1 fig, ax = plt.subplots(1, 2, figsize=(10, 5))
      2 np.random.seed(0)
----> 3 im1 = ps.generators.cylindrical_pillars_mesh(
      4     shape=[401, 601],
      5     a=500,
      6 )
      7 im2 = ps.generators.cylindrical_pillars_mesh(
      8     shape=[401, 601],
      9     a=5000,
     10 )
     12 ax[0].imshow(im1, origin="lower", interpolation="none")

File ~/work/porespy/porespy/src/porespy/generators/_micromodels.py:298, in cylindrical_pillars_mesh(shape, f, a, n, truncate)
    296 except ModuleNotFoundError:
    297     msg = "The nanomesh package can be installed with `pip install nanomesh`"
--> 298     raise ModuleNotFoundError(msg)
    300 shape = parse_shape(shape)
    301 if len(shape) != 2:

ModuleNotFoundError: The nanomesh package can be installed with `pip install nanomesh`
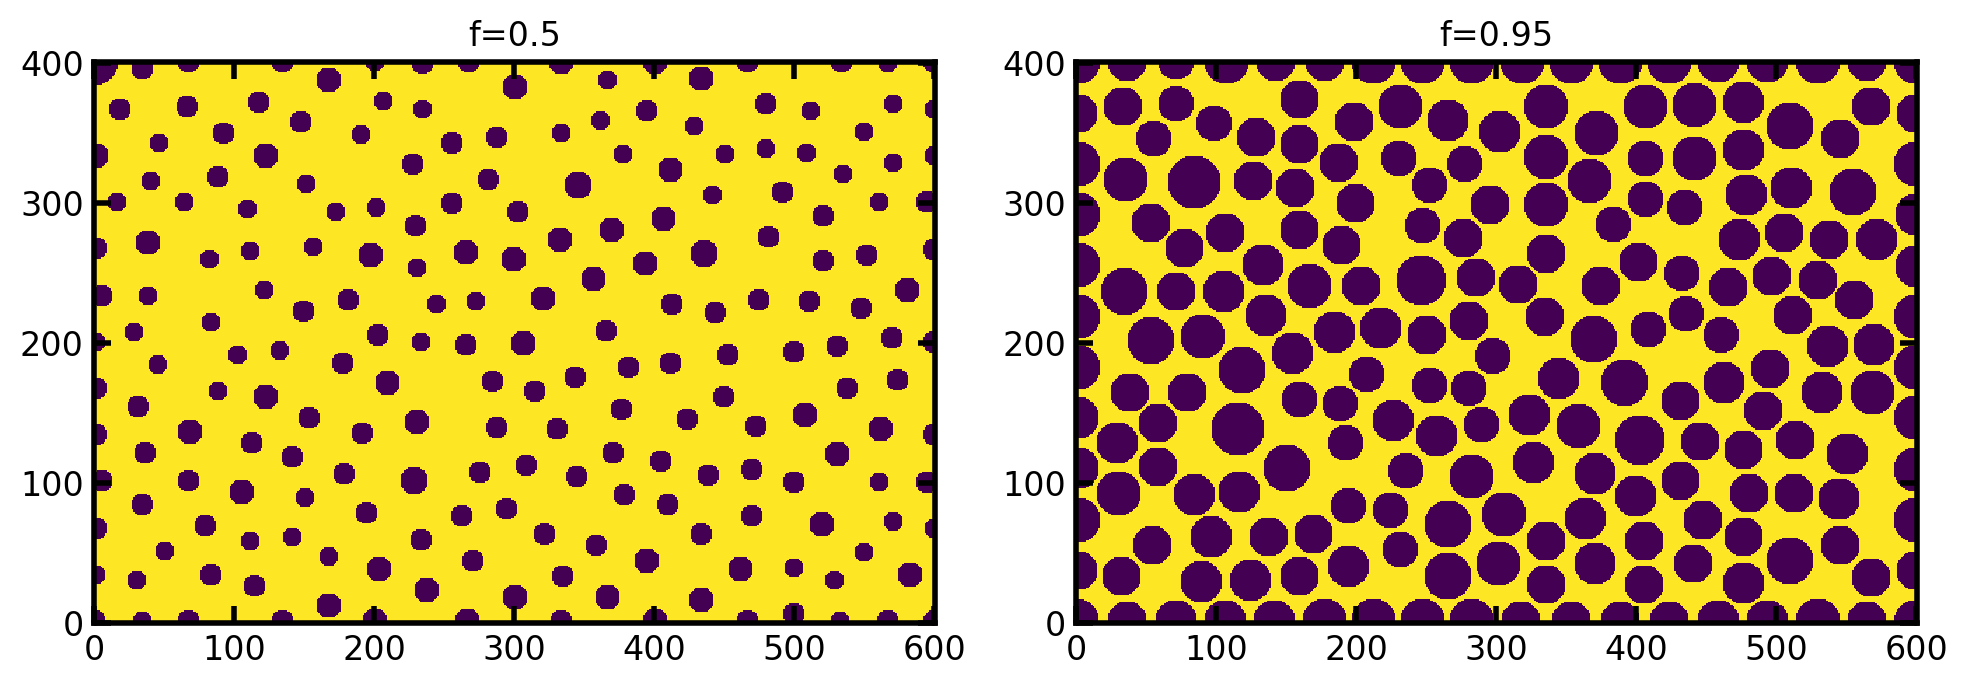
f#
A scale factor to control how large the pillars are relative their maximal size (i.e. overlapping neighboring pillars)
fig, ax = plt.subplots(1, 2, figsize=(10, 5))
np.random.seed(0)
im1 = ps.generators.cylindrical_pillars_mesh(
    shape=[401, 601],
    f=0.5,
)
im2 = ps.generators.cylindrical_pillars_mesh(
    shape=[401, 601],
    f=0.9,
)

ax[0].imshow(im1, origin="lower", interpolation="none")
ax[0].set_title("f=0.5")
ax[1].imshow(im2, origin="lower", interpolation="none")
ax[1].set_title("f=0.95");
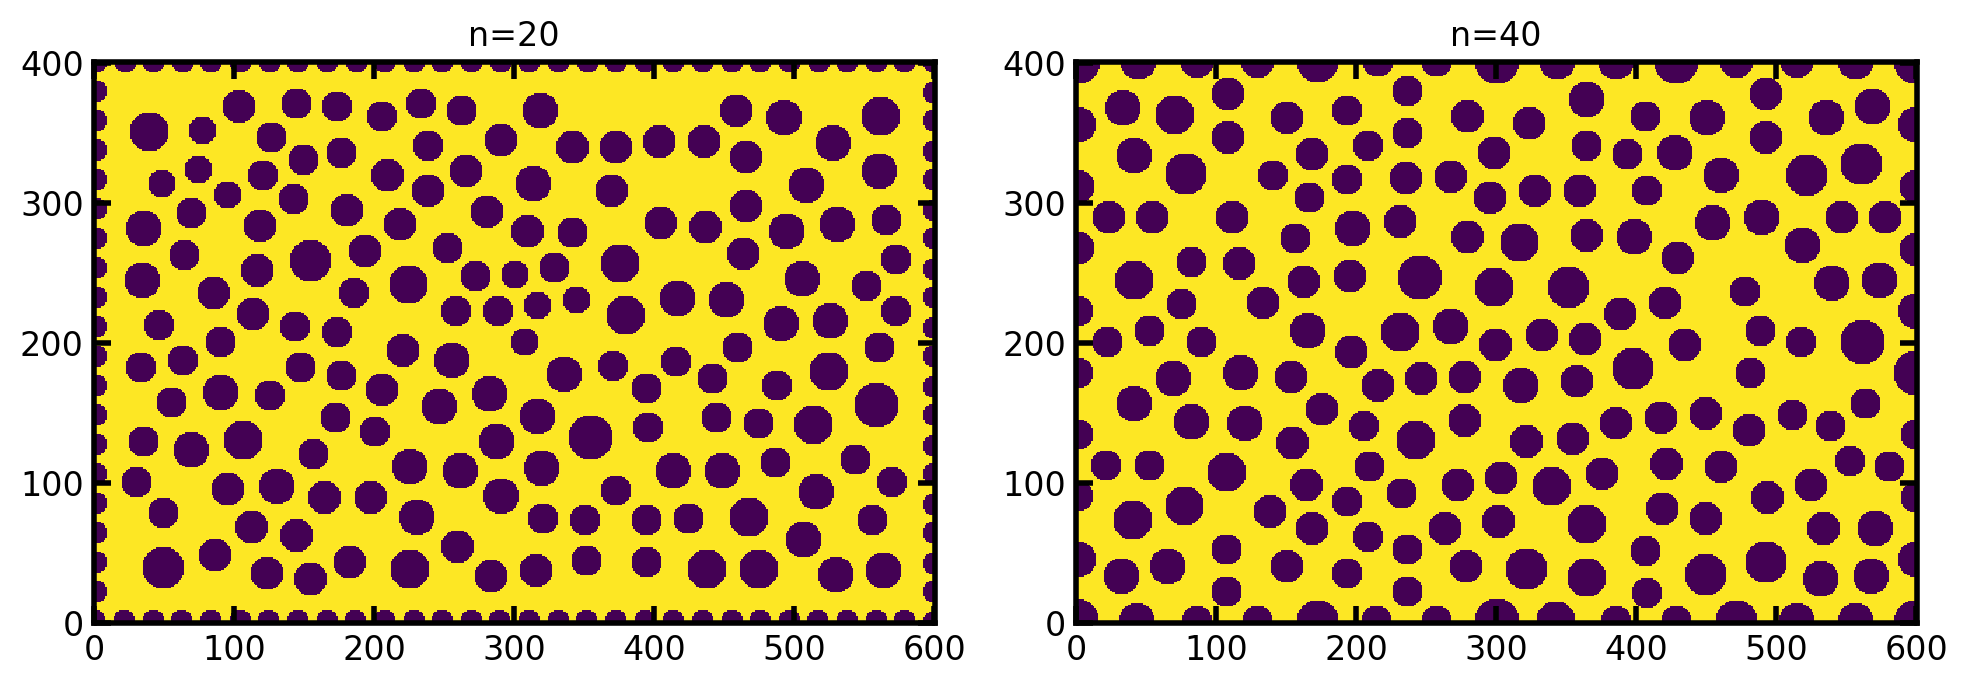
n#
Controls the density of pillars along the edges. The default is \(\sqrt{a}/f\), which does a decent job a keeping the edge pillars the same size as the internal ones, but this can be overwritten if needed. Or course if the pillars are very close together they will become smaller:
fig, ax = plt.subplots(1, 2, figsize=(10, 5))
np.random.seed(0)
im1 = ps.generators.cylindrical_pillars_mesh(
    shape=[401, 601],
    n=20,
)
im2 = ps.generators.cylindrical_pillars_mesh(
    shape=[401, 601],
    n=40,
)

ax[0].imshow(im1, origin="lower", interpolation="none")
ax[0].set_title("n=20")
ax[1].imshow(im2, origin="lower", interpolation="none")
ax[1].set_title("n=40");
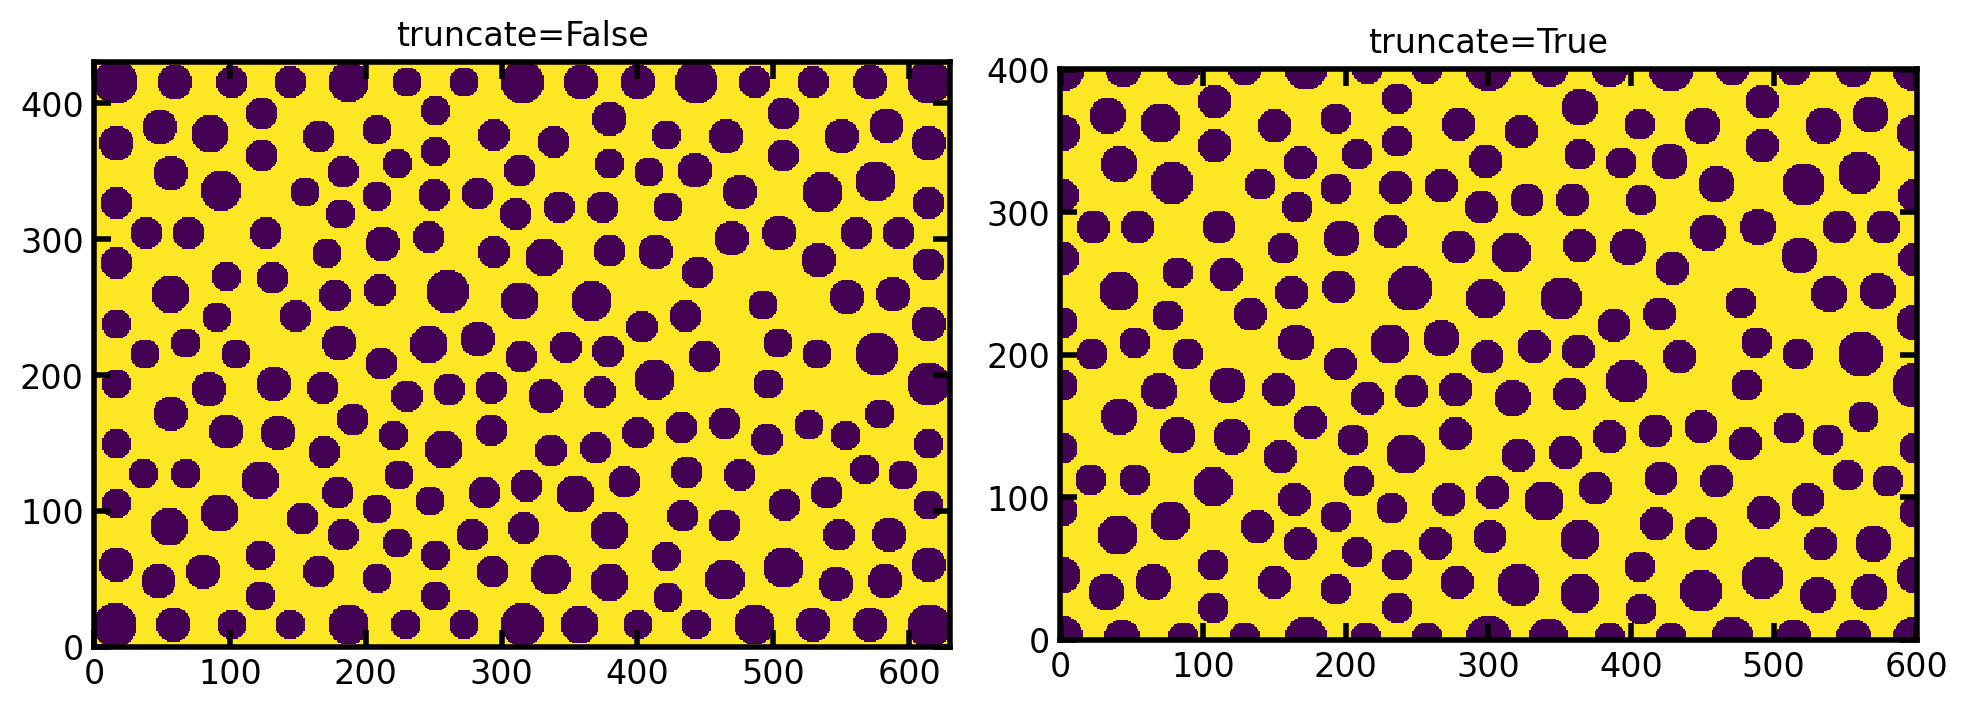
truncate#
If True it returns an image of the specified size by truncated the pillars on the edge of the image. If False it returns an image that is larger than the requested shape but contains the edge pillars in their entirety.
fig, ax = plt.subplots(1, 2, figsize=(10, 5))
np.random.seed(0)
im1 = ps.generators.cylindrical_pillars_mesh(
    shape=[401, 601],
    truncate=False,
)
im2 = ps.generators.cylindrical_pillars_mesh(
    shape=[401, 601],
    truncate=True,
)

ax[0].imshow(im1, origin="lower", interpolation="none")
ax[0].set_title("truncate=False")
ax[1].imshow(im2, origin="lower", interpolation="none")
ax[1].set_title("truncate=True");