is_percolating#
This function is for quickly determining in the void phase of an image percolates between specified inlets and outlets.
import matplotlib.pyplot as plt

import porespy as ps

ps.visualization.set_mpl_style()
im#
The image of the porous material with True indicating the void phase. Note that this can be applied any boolean image with the foreground treated as the phase of interest. The following two images at different porosities illustrate the function:
im1 = ps.generators.blobs([100, 100], porosity=0.7, seed=1)

fig, ax = plt.subplots(figsize=[4, 4])
ax.imshow(im1)
ax.axis(False)
ax.set_title("Porosity: 0.7");
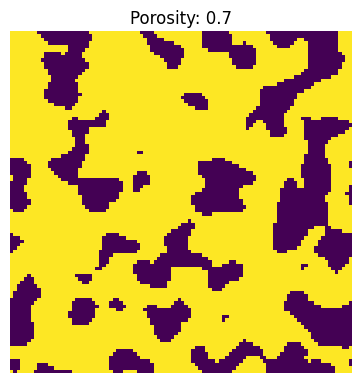
The function returns True if the image has a percolating path and False otherwise.
print(ps.metrics.is_percolating(im1, axis=1))
True
axis#
It is possible to specify which directions to check for percolation. The default is to check across all principle axes and return a list of True|False values corresponding to each direction. Individual axes can also be given:
im1 = ps.generators.blobs([100, 100], porosity=0.6, seed=6)

fig, ax = plt.subplots(figsize=[4, 4])
ax.imshow(im1)
ax.axis(False)
ax.set_title("Porosity: 0.55");
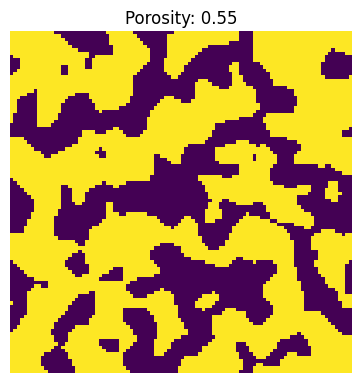
The default behavior is to return a boolean for each axis:
print(ps.metrics.is_percolating(im1))
[np.False_, np.True_]
But an axis can also be specified:
print(ps.metrics.is_percolating(im1, axis=0))
print(ps.metrics.is_percolating(im1, axis=1))
False
True
inlets and outlets#
If more complicated inlet and outlet conditions are desired, they can be specified using boolean masks and provided to the inlets and outlets arguments:
inlets = ps.generators.faces(im1.shape, inlet=0)
outlets = ps.generators.faces(im1.shape, inlet=1)
fig, ax = plt.subplots(1, 2, figsize=[8, 4])
ax[0].imshow(im1)
ax[0].axis(False)
ax[1].imshow(inlets * 1.0 + outlets * 2.0)
ax[1].axis(False);
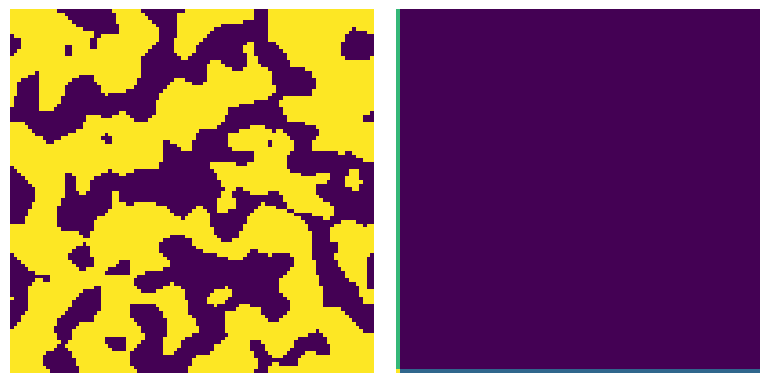
print(ps.metrics.is_percolating(im1, inlets=inlets, outlets=outlets))
True
conn#
The connectivity to use when checking for percolation can also be specified. The default is min, which means 4 neighbors in 2D and 6 in 3D, but it can also be max which adds diagonal connections to create 8 neighbors in 2D and 26 in 3D:
im2 = ps.generators.blobs([100, 100], porosity=0.52, seed=6)

fig, ax = plt.subplots(figsize=[4, 4])
ax.imshow(im2)
ax.axis(False)
ax.set_title("Porosity: 0.55");
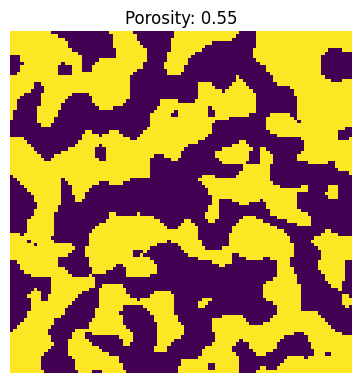
In the image above there are clusters which would be considered connected using maximal connectivity, but not otherwise:
print(ps.metrics.is_percolating(im2, axis=1, conn="min"))
print(ps.metrics.is_percolating(im2, axis=1, conn="max"))
False
True