apply_chords#
Adds chords to the void space in the specified direction
import matplotlib.pyplot as plt

import porespy as ps

ps.visualization.set_mpl_style()
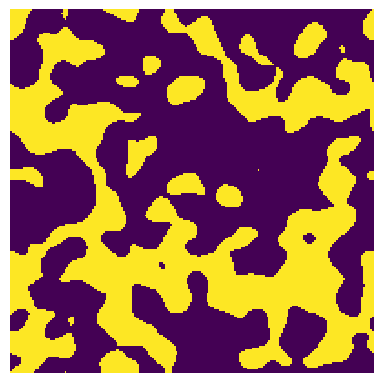
shape#
shape = [200, 200]
im = ps.generators.blobs(shape=shape, porosity=0.4)
fig, ax = plt.subplots(1, 1, figsize=[4, 4])
ax.imshow(im, origin="lower", interpolation="none")
ax.axis(False);
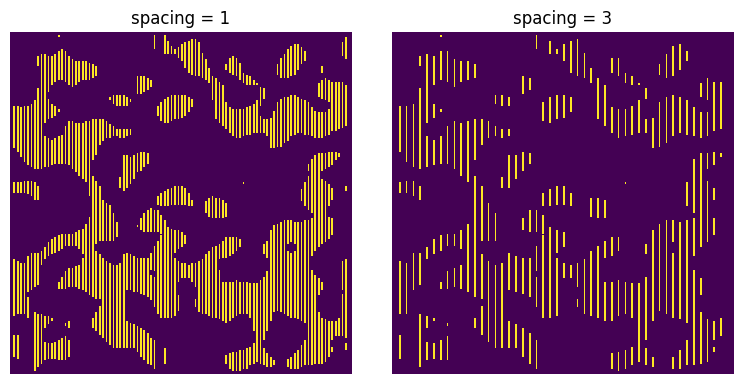
spacing#
Separation between chords. The default is 1 voxel. This can be decreased to 0, meaning that the chords all touch each other, which automatically sets to the label argument to True
x = ps.filters.apply_chords(im=im, spacing=1)
xx = ps.filters.apply_chords(im=im, spacing=3)


fig, ax = plt.subplots(1, 2, figsize=[8, 4])
ax[0].imshow(x)
ax[1].imshow(xx)
ax[0].axis(False)
ax[1].axis(False)
ax[0].set_title("spacing = 1")
ax[1].set_title("spacing = 3");
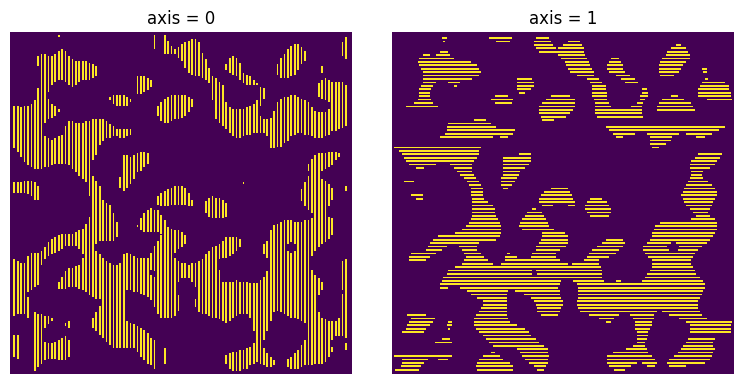
axis#
The axis along which the chords are drawn.
xx = ps.filters.apply_chords(im=im, axis=1)

fig, ax = plt.subplots(1, 2, figsize=[8, 4])
ax[0].imshow(x)
ax[1].imshow(xx)
ax[0].axis(False)
ax[1].axis(False)
ax[0].set_title("axis = 0")
ax[1].set_title("axis = 1");
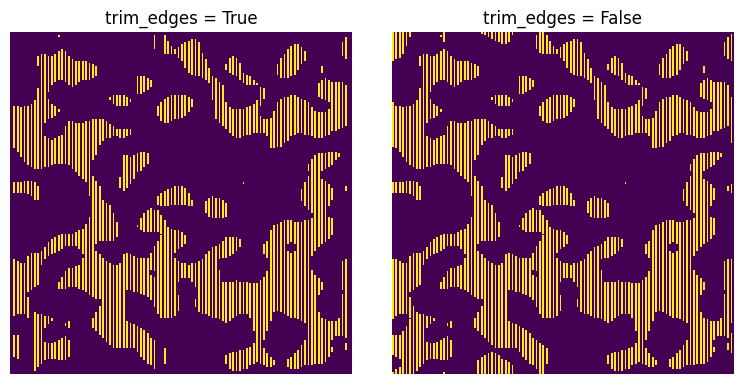
trim_edges#
Whether or not to remove chords that touch the edges of the image. The default is True.
xx = ps.filters.apply_chords(im=im, trim_edges=False)

fig, ax = plt.subplots(1, 2, figsize=[8, 4])
ax[0].imshow(x)
ax[1].imshow(xx)
ax[0].axis(False)
ax[1].axis(False)
ax[0].set_title("trim_edges = True")
ax[1].set_title("trim_edges = False");
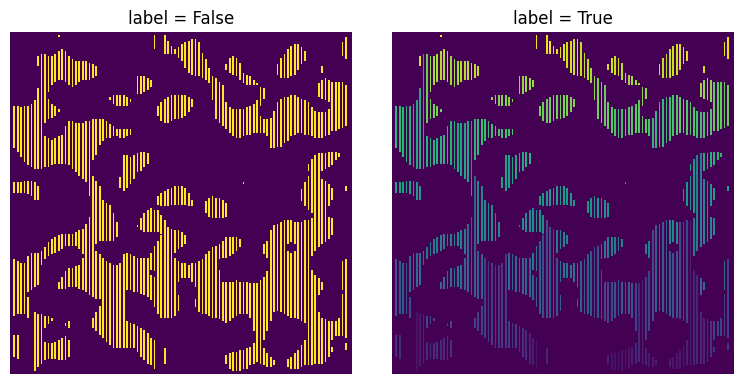
label#
If True the chords in the returned image are each given a unique label, such that all voxels lying on the same chord have the same value. This is automatically set to True if spacing is 0, but is False otherwise.
xx = ps.filters.apply_chords(im=im, label=True)

fig, ax = plt.subplots(1, 2, figsize=[8, 4])
ax[0].imshow(x)
ax[1].imshow(xx)
ax[0].axis(False)
ax[1].axis(False)
ax[0].set_title("label = False")
ax[1].set_title("label = True");