props_to_image#
Values from the regionprops_3D function can be mapped back onto the original image.
import porespy as ps
import numpy as np
import matplotlib.pyplot as plt
import scipy.ndimage as spim

ps.visualization.set_mpl_style()
im = ~ps.generators.overlapping_spheres([100, 100], r=10, porosity=0.6, seed=7)

fig, ax = plt.subplots(figsize=[4, 4])
ax.imshow(im, origin="lower", interpolation="none")
ax.axis(False);

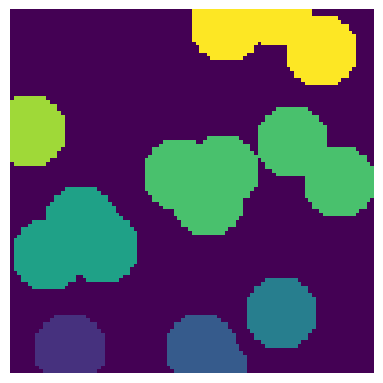
regions = spim.label(im)[0]
props = ps.metrics.regionprops_3D(regions)

fig, ax = plt.subplots(figsize=[4, 4])
ax.imshow(regions, origin="lower", interpolation="none")
ax.axis(False);
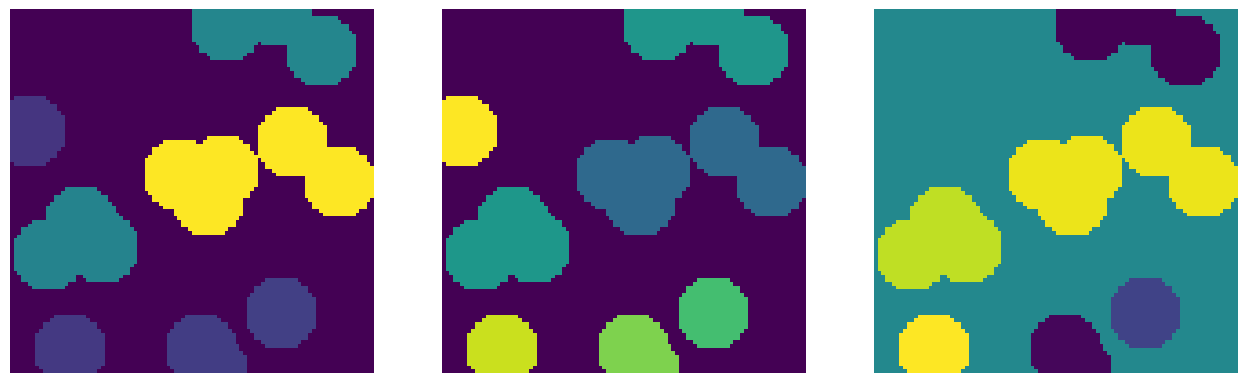
im1 = ps.metrics.prop_to_image(props, im.shape, "convex_volume")
im2 = ps.metrics.prop_to_image(props, im.shape, "sphericity")
im3 = ps.metrics.prop_to_image(props, im.shape, "orientation")

fig, ax = plt.subplots(1, 3, figsize=[14, 4])
ax[0].imshow(im1, origin="lower", interpolation="none")
ax[0].axis(False)
ax[1].imshow(im2, origin="lower", interpolation="none")
ax[1].axis(False)
ax[2].imshow(im3, origin="lower", interpolation="none")
ax[2].axis(False);