boxcount#
A method for measuring the fractal dimension of an image
import matplotlib.pyplot as plt
import numpy as np
import porespy as ps
im = ps.generators.sierpinski_foam([3**5, 3**5], n=5, mode=None)
fig, ax = plt.subplots(1, 1, figsize=[6, 6])
ax.imshow(im, interpolation="none", origin="lower")
ax.axis(False);
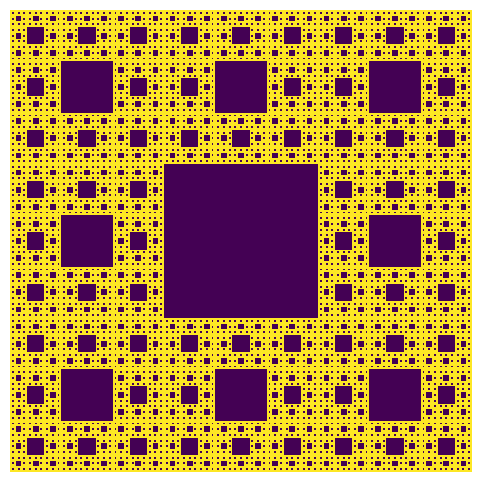
im#
The image which is to be analzyed. Can be 2D or 3D.
b = ps.metrics.boxcount(im=im)
print(b)
――――――――――――――――――――――――――――――――――――――――――――――――――――――――――――――――――――――――――――――
Results of boxcount generated at Sun Mar  1 04:01:26 2026
――――――――――――――――――――――――――――――――――――――――――――――――――――――――――――――――――――――――――――――
size                      Array of size (10,)
count                     [np.int64(544), np.int64(291), np.int64(160), np.int64(77), np.int64(35), np.int64(25), np.int64(9), np.int64(9), np.int64(4), np.int64(1)]
slope                     Array of size (10,)
――――――――――――――――――――――――――――――――――――――――――――――――――――――――――――――――――――――――――――――
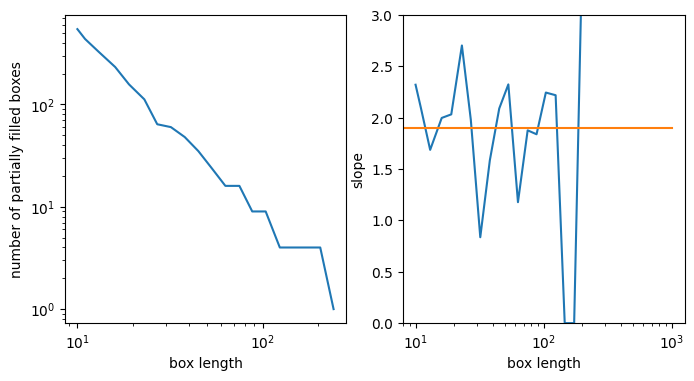
The returned object is like a dataclass with each computed value stored in an attribute. The result can be printed for inspection. The results can also be plotted as follows:
fig, ax = plt.subplots(1, 2, figsize=[8, 4])
ax[0].loglog(b.size, b.count)
ax[0].set_xlabel("box length")
ax[0].set_ylabel("number of partially filled boxes")

ax[1].semilogx(b.size, b.slope)
ax[1].plot([0, 1000], [1.9, 1.9])
ax[1].set_xlabel("box length")
ax[1].set_ylabel("slope")
ax[1].set_ylim([0, 3]);
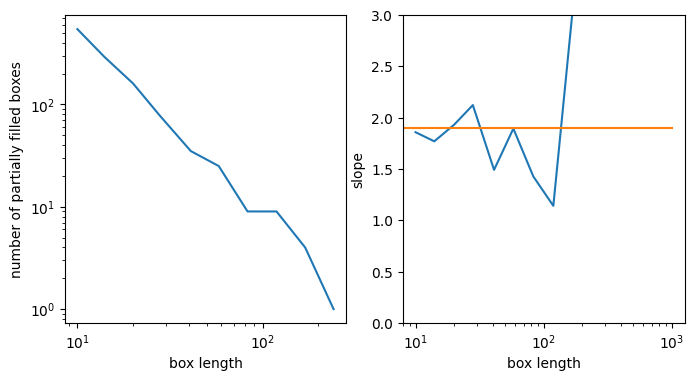
bins#
The box sizes to use. The default is 10. If an integer is given it computes the range of box sizes. If an array is given, these are used directly
b = ps.metrics.boxcount(im=im, bins=20)
fig, ax = plt.subplots(1, 2, figsize=[8, 4])
ax[0].loglog(b.size, b.count)
ax[0].set_xlabel("box length")
ax[0].set_ylabel("number of partially filled boxes")

ax[1].semilogx(b.size, b.slope)
ax[1].plot([0, 1000], [1.9, 1.9])
ax[1].set_xlabel("box length")
ax[1].set_ylabel("slope")
ax[1].set_ylim([0, 3]);