random_spheres#
Generates randomly located, non-overlapping spheres using the ‘random sequential addition’ technique.
import matplotlib.pyplot as plt
import numpy as np

import porespy as ps

ps.visualization.set_mpl_style()
im or shape#
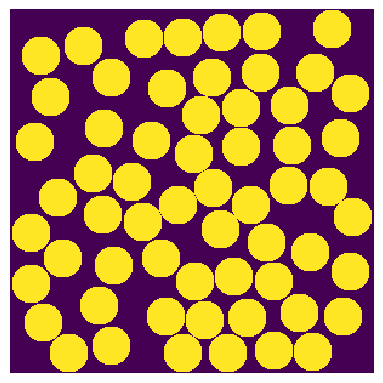
The function can either add spheres an existing image, or create a new image of the given shape and add spheres to that. Let’s start with an empty image, and set the void fraction to a low value:
shape = [300, 300]
r = 15
im = ps.generators.random_spheres(shape=shape, r=r)
fig, ax = plt.subplots(1, 1, figsize=[4, 4])
ax.axis(False)
ax.imshow(im, origin="lower", interpolation="none");
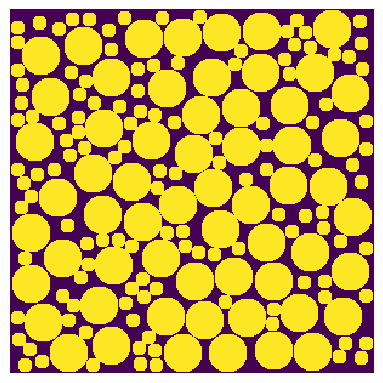
Now let’s fill up the remaining space with as many smaller spheres as possible:
r = 5
im = ps.generators.random_spheres(im=im, r=r)
fig, ax = plt.subplots(1, 1, figsize=[4, 4])
ax.axis(False)
ax.imshow(im, origin="lower", interpolation="none");
edges#
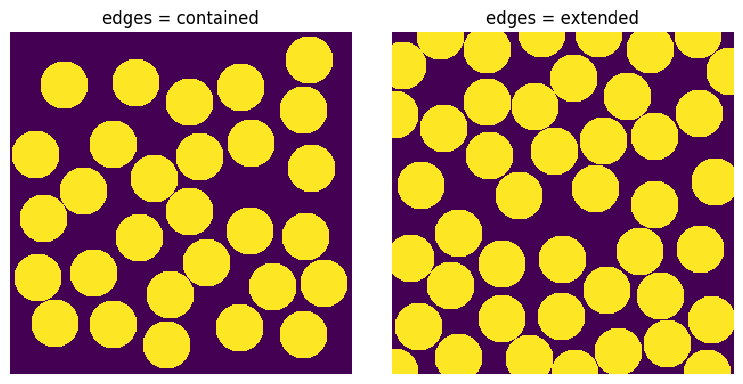
Spheres can either be fully contained within the image or be truncated at the edges:
fig, ax = plt.subplots(1, 2, figsize=[8, 4])

r = 20
mode = "contained"
im1 = ps.generators.random_spheres(shape=shape, r=r, edges=mode)
ax[0].imshow(im1, origin="lower", interpolation="none")
ax[0].axis(False)
ax[0].set_title(f"edges = {mode}")

mode = "extended"
im2 = ps.generators.random_spheres(shape=shape, r=r, edges=mode)
ax[1].imshow(im2, origin="lower", interpolation="none")
ax[1].axis(False)
ax[1].set_title(f"edges = {mode}");
clearance#
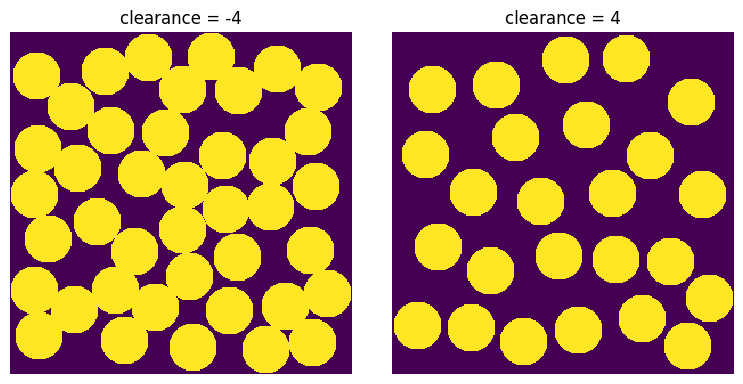
Spheres can be made to partially overlap, the so called ‘cherry pit’ model, or to have some clearance:
fig, ax = plt.subplots(1, 2, figsize=[8, 4])

c = -4
im1 = ps.generators.random_spheres(shape=shape, r=r, clearance=c)
ax[0].imshow(im1, origin="lower", interpolation="none")
ax[0].axis(False)
ax[0].set_title(f"clearance = {c}")

c = 4
im2 = ps.generators.random_spheres(shape=shape, r=r, clearance=c)
ax[1].imshow(im2, origin="lower", interpolation="none")
ax[1].axis(False)
ax[1].set_title(f"clearance = {c}");
protrusion#
This controls how much the added spheres are allowed to protrude into the background.
im1 = ps.generators.blobs(shape=[300, 300], porosity=0.5)
im2 = ps.generators.random_spheres(im=im1, r=8, protrusion=-5)
im3 = ps.generators.random_spheres(im=im1, r=8, protrusion=5)

fig, ax = plt.subplots(1, 3, figsize=[10, 4])
ax[0].imshow(im1, origin="lower", interpolation="none")
ax[1].imshow(im2, origin="lower", interpolation="none")
ax[2].imshow(im3, origin="lower", interpolation="none");
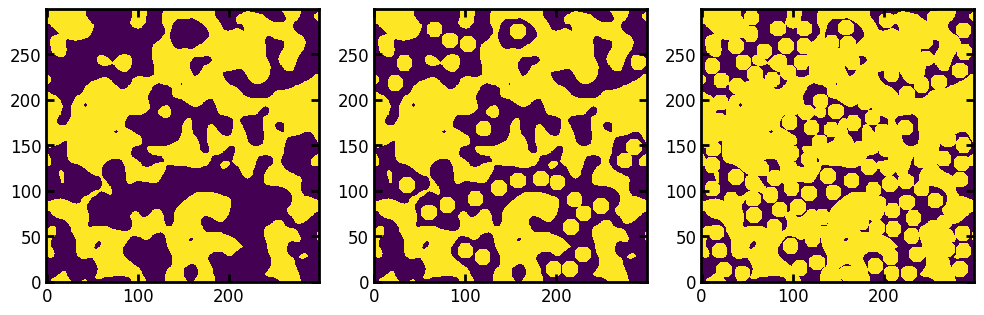
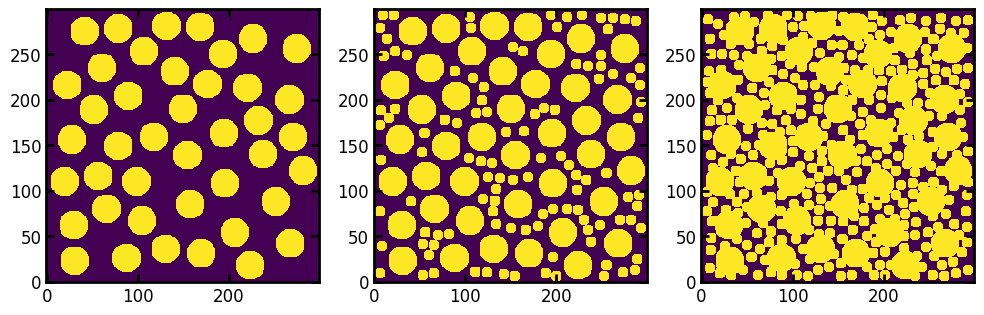
In the case of pre-existing spheres this can be used to give some clearance between existing spheres and new ones by using a negative value:
im1 = np.zeros([300, 300])
im2 = ps.generators.random_spheres(im=im1, r=15, clearance=5)
im3 = ps.generators.random_spheres(im=im2, r=5, protrusion=-5)
im4 = ps.generators.random_spheres(im=im2, r=5, protrusion=5)

fig, ax = plt.subplots(1, 3, figsize=[10, 4])
ax[0].imshow(im2, origin="lower", interpolation="none")
ax[1].imshow(im3, origin="lower", interpolation="none")
ax[2].imshow(im4, origin="lower", interpolation="none");
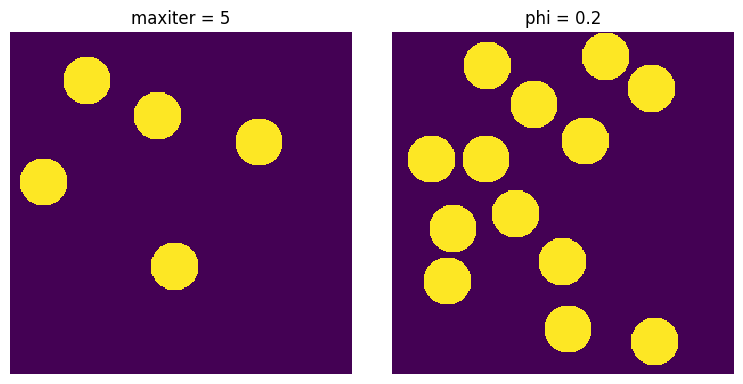
phi and maxiter#
The number of spheres to add can be controlled directly by specifying maxiter, or implicitly by specifying phi (the solid volume fraction). Setting phi will attempt to compute the correct value of maxiter internally so will not give the exact phi requested:
fig, ax = plt.subplots(1, 2, figsize=[8, 4])

maxiter = 5
im1 = ps.generators.random_spheres(shape=shape, r=r, clearance=c, maxiter=maxiter)
ax[0].imshow(im1, origin="lower", interpolation="none")
ax[0].axis(False)
ax[0].set_title(f"maxiter = {maxiter}")

vf = 0.2
im2 = ps.generators.random_spheres(shape=shape, r=r, clearance=c, phi=vf)
ax[1].axis(False)
ax[1].set_title(f"phi = {vf}")
ax[1].imshow(im2, origin="lower", interpolation="none");
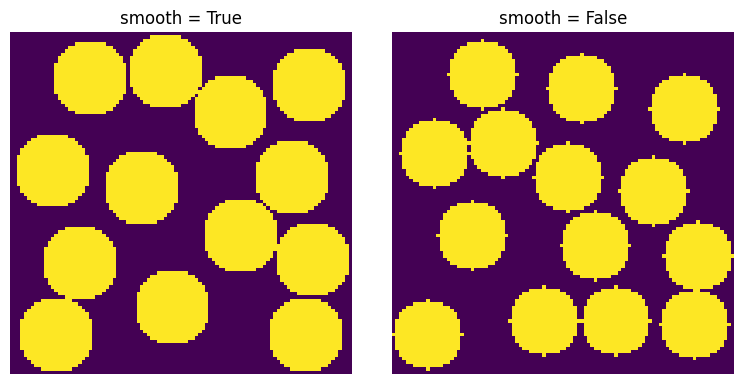
smooth#
Controls whether or not the inserted spheres have the little nibs or pips on each face. Note that if smooth=True, then r is increased by 1 to ensure the radius of the inserted spheres matches the requested value.
fig, ax = plt.subplots(1, 2, figsize=[8, 4])

smooth = True
im1 = ps.generators.random_spheres(shape=[100, 100], r=10, smooth=smooth)
ax[0].imshow(im1, origin="lower", interpolation="none")
ax[0].axis(False)
ax[0].set_title(f"smooth = {smooth}")

smooth = False
im2 = ps.generators.random_spheres(shape=[100, 100], r=10, smooth=smooth)
ax[1].axis(False)
ax[1].set_title(f"smooth = {smooth}")
ax[1].imshow(im2, origin="lower", interpolation="none");
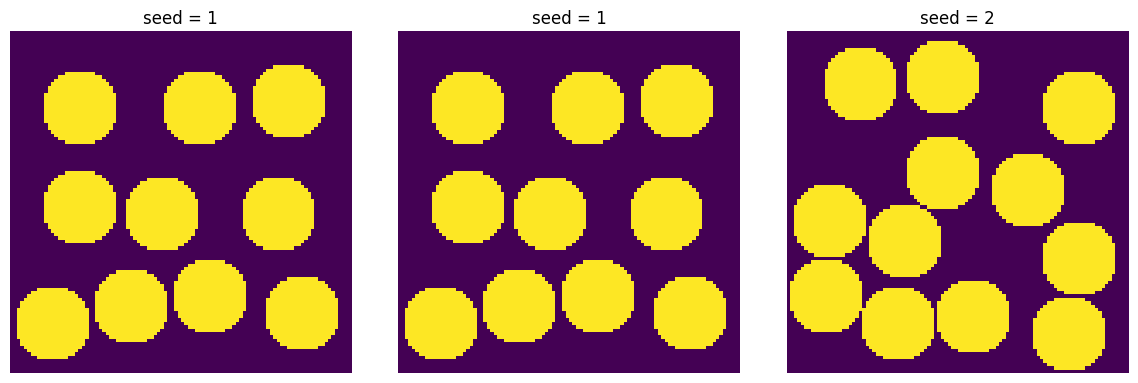
seed#
This function uses numba to accelerate the insertion process, which means that the numpy random number generator is not used. To generate a repeatable realization of the spheres, pass an integer value to the seed argument:
fig, ax = plt.subplots(1, 3, figsize=[12, 4])

seed = 1
im1 = ps.generators.random_spheres(shape=[100, 100], r=10, seed=seed)
ax[0].imshow(im1, origin="lower", interpolation="none")
ax[0].axis(False)
ax[0].set_title(f"seed = {seed}")

seed = 1
im2 = ps.generators.random_spheres(shape=[100, 100], r=10, seed=seed)
ax[1].axis(False)
ax[1].set_title(f"seed = {seed}")
ax[1].imshow(im2, origin="lower", interpolation="none")

seed = 2
im2 = ps.generators.random_spheres(shape=[100, 100], r=10, seed=seed)
ax[2].axis(False)
ax[2].set_title(f"seed = {seed}")
ax[2].imshow(im2, origin="lower", interpolation="none");
value#
The default behavior is to insert spheres with values of 0 or False, but this can be specified using the value argument. This is useful when inserting several different sizes of spheres sequentially:
fig, ax = plt.subplots(1, 2, figsize=[8, 4])

value = 2
im1 = ps.generators.random_spheres(shape=[100, 100], r=10, value=value)
im1 = ps.generators.random_spheres(im=im1, r=5, value=value + 2, protrusion=-2)
h = ax[0].imshow(im1, origin="lower", interpolation="none")
ax[0].axis(False)
ax[0].set_title(f"value = {value} and {value + 2}")
fig.colorbar(h)

value = -2
im2 = ps.generators.random_spheres(shape=[100, 100], r=10, value=value)
im2 = ps.generators.random_spheres(im=im2, r=5, value=value - 2, protrusion=-2)
h = ax[1].imshow(im2, origin="lower", interpolation="none")
ax[1].axis(False)
ax[1].set_title(f"value = {value} and {value - 2}")
fig.colorbar(h);
