nl_means_layered#
Applies the non-local means filter to each 2D layer of a 3D image (stack of 2D images) in parallel. This function is applicable in removing noise from SEM images.
import matplotlib.pyplot as plt
import numpy as np
import porespy as ps
from skimage.util import random_noise

ps.visualization.set_mpl_style()
im#
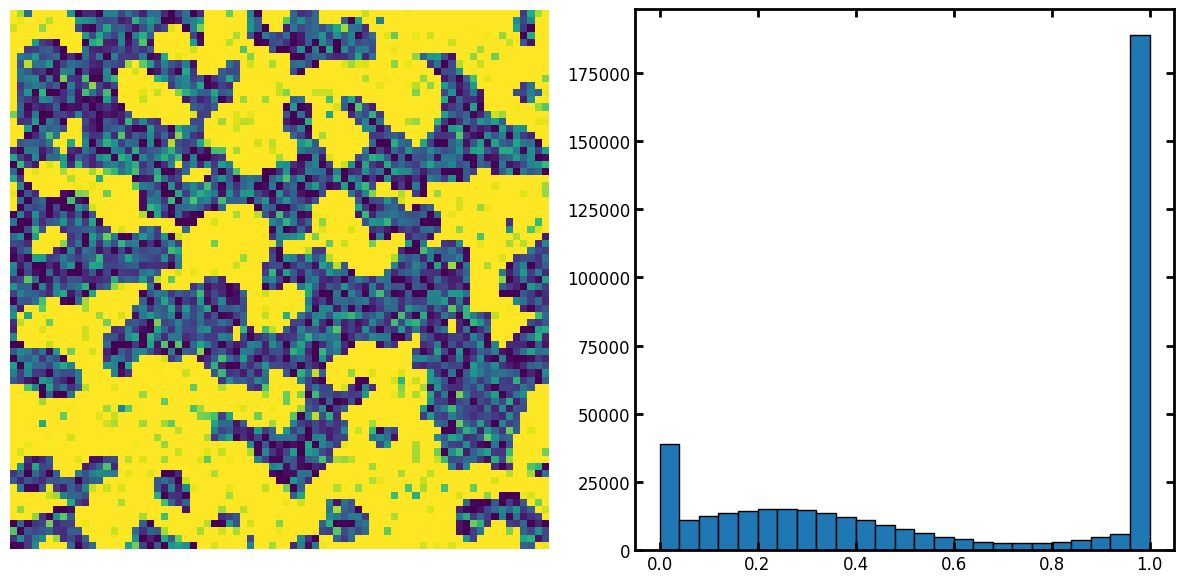
The input image is a greyscale image with noise to be removed. Let’s create a test image:
np.random.seed(10)
im = ps.generators.blobs(shape=[75, 75, 75])
im2 = random_noise(im, mode="gaussian", mean=0.24, var=0.05)
fig, ax = plt.subplots(1, 2, figsize=[12, 6])
ax[0].imshow(im2[:, :, 15])
ax[0].axis(False)
ax[1].hist(im2.flatten(), bins=25, edgecolor="k");
filtered_im = ps.filters.nl_means_layered(im2, axis=2)
fig, ax = plt.subplots(1, 3, figsize=[15, 5])
ax[0].imshow(filtered_im[..., 15])
ax[0].axis(False)
ax[1].hist(filtered_im.flatten(), bins=25, edgecolor="k")
ax[2].imshow(filtered_im[..., 15] > 0.6)
ax[2].axis(False);
---------------------------------------------------------------------------
ModuleNotFoundError                       Traceback (most recent call last)
File ~/work/porespy/porespy/.venv/lib/python3.13/site-packages/skimage/restoration/_denoise.py:1102, in estimate_sigma(image, average_sigmas, channel_axis)
   1101 try:
-> 1102     import pywt
   1103 except ImportError:

ModuleNotFoundError: No module named 'pywt'

During handling of the above exception, another exception occurred:

ImportError                               Traceback (most recent call last)
Cell In[3], line 1
----> 1 filtered_im = ps.filters.nl_means_layered(im2, axis=2)
      2 fig, ax = plt.subplots(1, 3, figsize=[15, 5])
      3 ax[0].imshow(filtered_im[..., 15])

File ~/work/porespy/porespy/src/porespy/filters/_nlmeans.py:75, in nl_means_layered(im, cores, axis, patch_size, patch_distance, h)
     73 temp = rescale_intensity(temp, in_range=(p2, p98))
     74 temp = temp / temp.max()
---> 75 sigma_est = np.mean(estimate_sigma(temp[0, ...]))
     77 kw = {'image': temp,
     78       'patch_size': patch_size,
     79       'patch_distance': patch_distance,
     80       'h': h * sigma_est,
     81       'fast_mode': True}
     83 results = []

File ~/work/porespy/porespy/.venv/lib/python3.13/site-packages/skimage/restoration/_denoise.py:1104, in estimate_sigma(image, average_sigmas, channel_axis)
   1102     import pywt
   1103 except ImportError:
-> 1104     raise ImportError(
   1105         'PyWavelets is not installed. Please ensure it is installed in '
   1106         'order to use this function.'
   1107     )
   1109 if channel_axis is not None:
   1110     channel_axis = channel_axis % image.ndim

ImportError: PyWavelets is not installed. Please ensure it is installed in order to use this function.
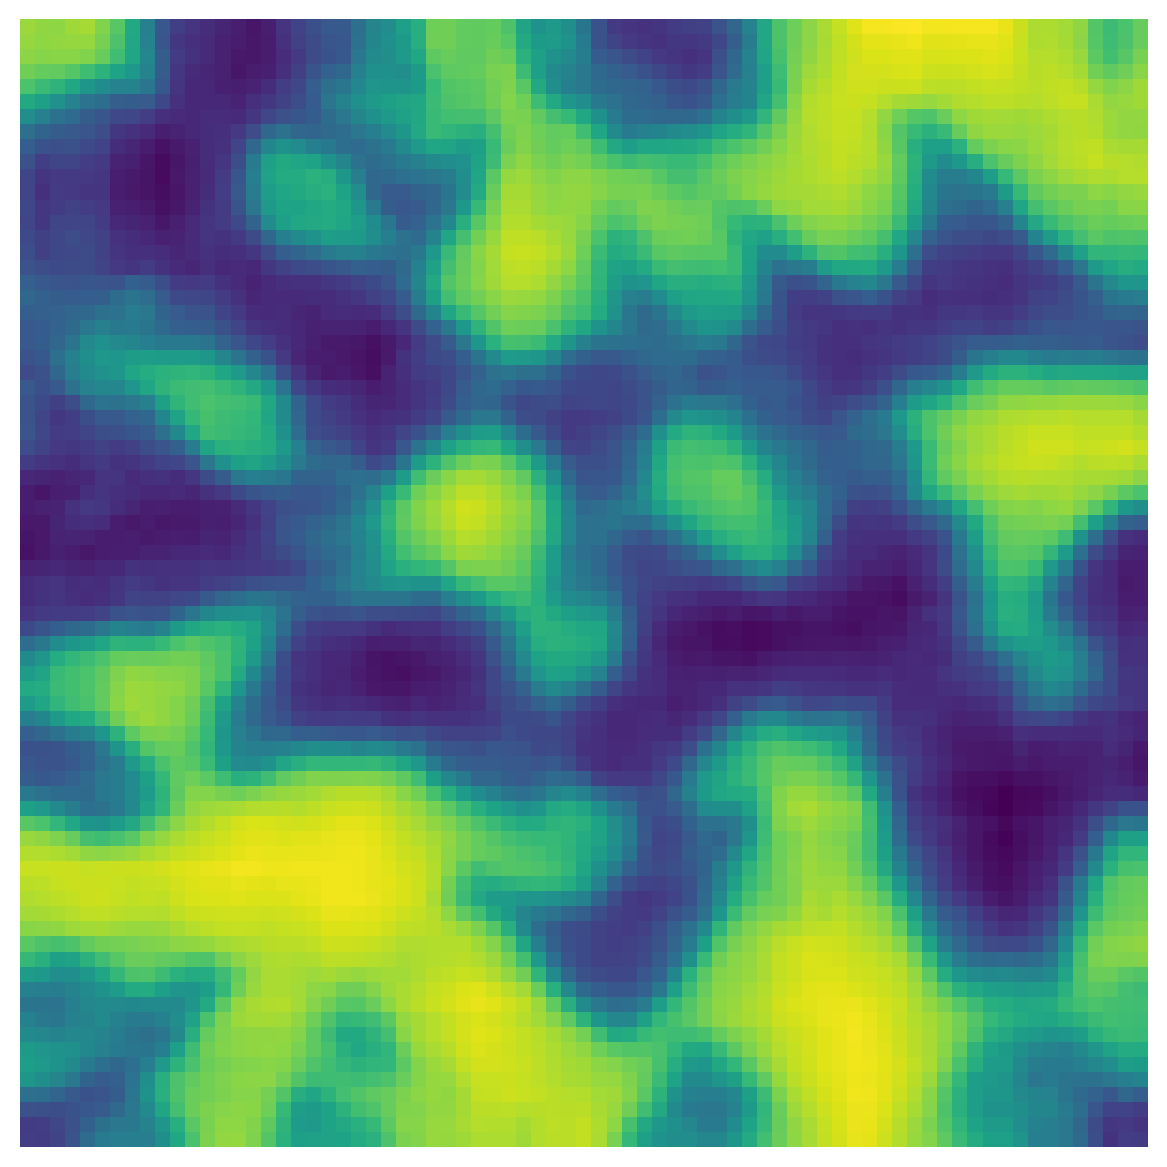
cores#
The number of cores to use for the processing. The default is all cores. Let’s change it to a smaller number (this will slow down the processing time):
filtered_im = ps.filters.nl_means_layered(im2, axis=2, cores=1)
fig, ax = plt.subplots(1, 1, figsize=[6, 6])
ax.imshow(filtered_im[:, :, 15])
ax.axis(False);
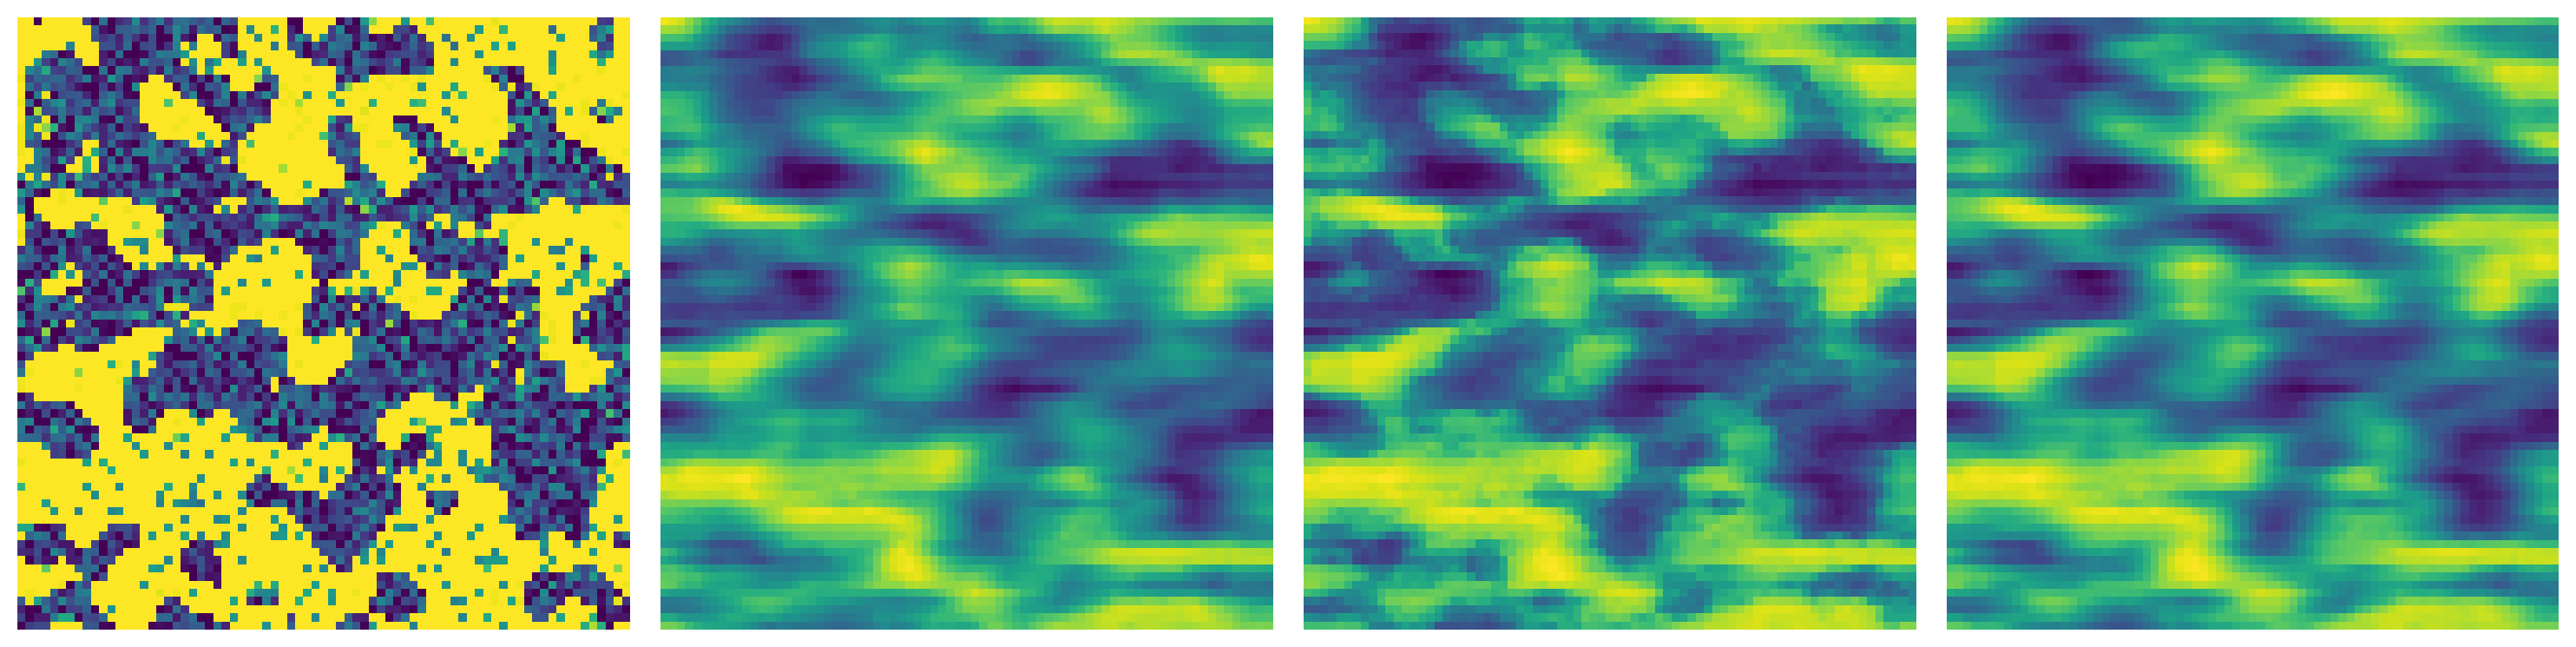
axis#
The axis along which 2D slices for the filtering process should be taken. This can be 0,1, or 2 corresponding to x, y, and z axis. By default the slices are taken along x axis. When using tomography images, this should correspond to the axis of rotation of the tomography stage.
im_x = ps.filters.nl_means_layered(im2, axis=0)
im_y = ps.filters.nl_means_layered(im2, axis=1)
im_z = ps.filters.nl_means_layered(im2, axis=2)
fig, ax = plt.subplots(1, 4, figsize=[15, 5])
ax[0].imshow(im2[..., 15])
ax[0].axis(False)
ax[1].imshow(im_x[..., 15])
ax[1].axis(False)
ax[2].imshow(im_y[..., 15])
ax[2].axis(False)
ax[3].imshow(im_z[..., 15])
ax[3].axis(False);

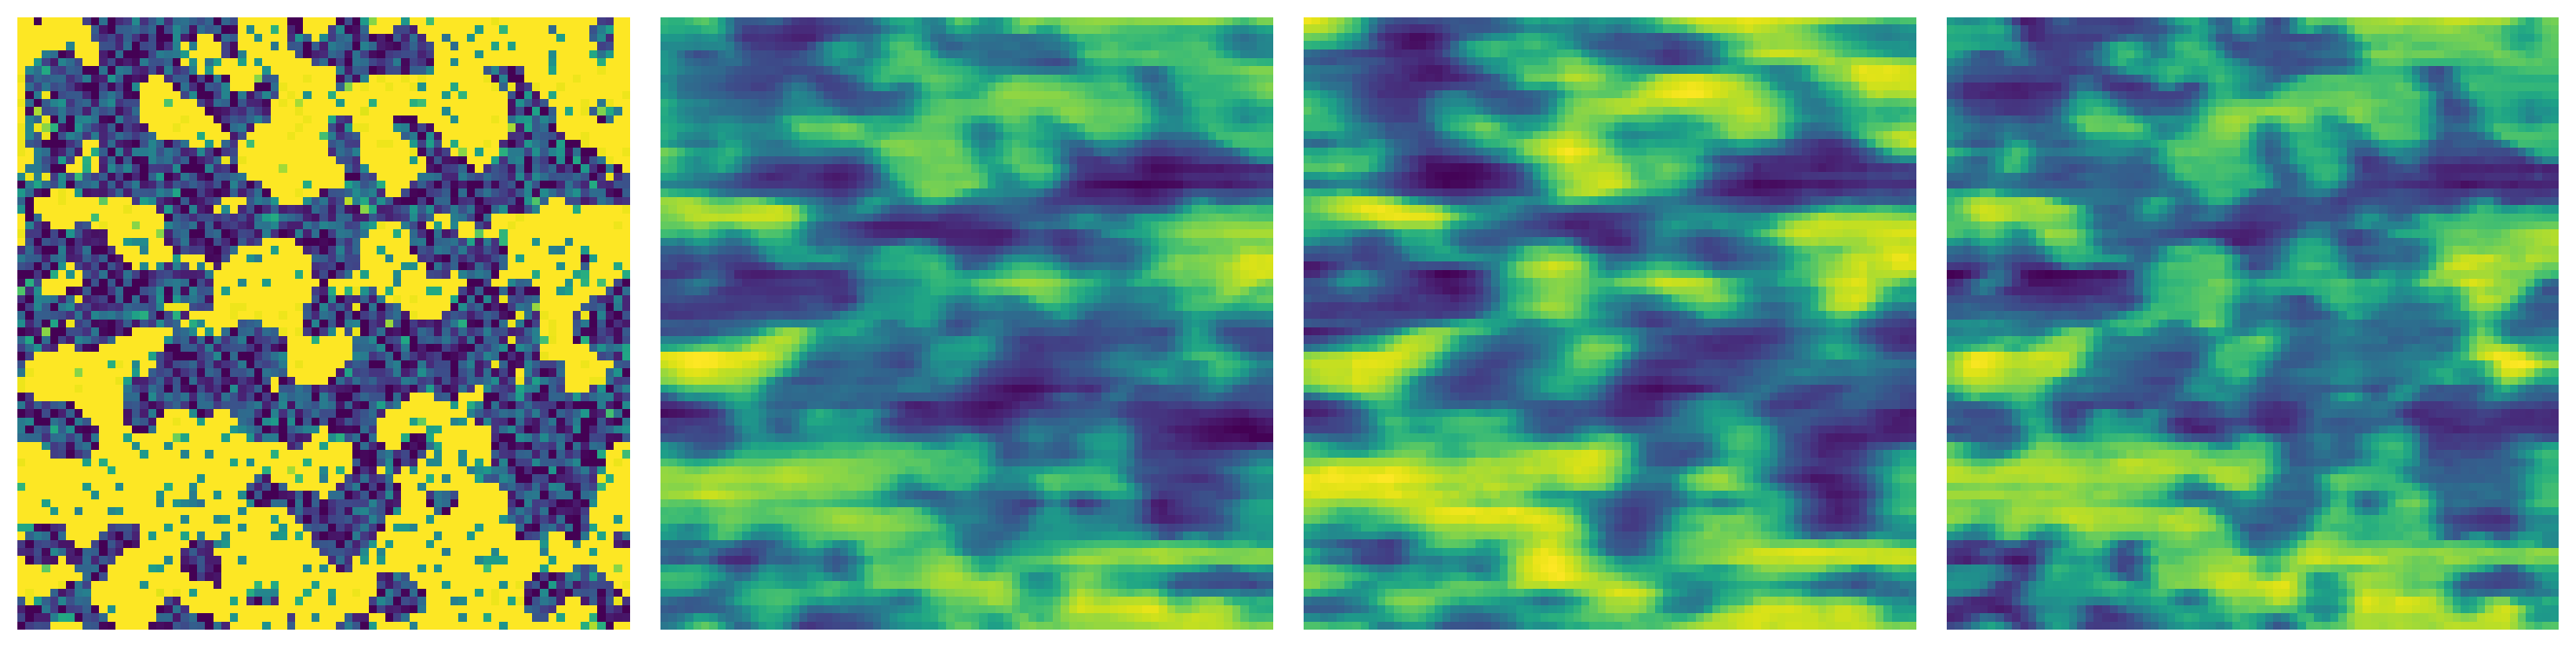
patch_size#
The size of patches used for denoising filter. The default is 5.
im_1 = ps.filters.nl_means_layered(im2, patch_size=1)
im_2 = ps.filters.nl_means_layered(im2, patch_size=3)
im_3 = ps.filters.nl_means_layered(im2, patch_size=8)
fig, ax = plt.subplots(1, 4, figsize=[15, 5])
ax[0].imshow(im2[..., 15])
ax[0].axis(False)
ax[1].imshow(im_1[..., 15])
ax[1].axis(False)
ax[2].imshow(im_2[..., 15])
ax[2].axis(False)
ax[3].imshow(im_3[..., 15])
ax[3].axis(False);
patch_distance#
Maximal distance in pixels where to search patches used for denoising. The default is 15.
im_1 = ps.filters.nl_means_layered(im2, patch_distance=10)
im_2 = ps.filters.nl_means_layered(im2)
im_3 = ps.filters.nl_means_layered(im2, patch_distance=20)
fig, ax = plt.subplots(1, 4, figsize=[15, 5])
ax[0].imshow(im2[..., 15])
ax[0].axis(False)
ax[1].imshow(im_1[..., 15])
ax[1].axis(False)
ax[2].imshow(im_2[..., 15])
ax[2].axis(False)
ax[3].imshow(im_3[..., 15])
ax[3].axis(False);
h#
Cut-off distance (in gray levels). The higher h, the more permissive one is in accepting patches. A higher h results in a
smoother image, at the expense of blurring features. For a Gaussian noise of standard deviation sigma, a rule of thumb is to choose the value of h to be sigma of slightly less. The default is 4.
im_1 = ps.filters.nl_means_layered(im2, h=2)
im_2 = ps.filters.nl_means_layered(im2)
im_3 = ps.filters.nl_means_layered(im2, h=6)
fig, ax = plt.subplots(1, 4, figsize=[15, 5])
ax[0].imshow(im2[..., 15])
ax[0].axis(False)
ax[1].imshow(im_1[..., 15])
ax[1].axis(False)
ax[2].imshow(im_2[..., 15])
ax[2].axis(False)
ax[3].imshow(im_3[..., 15])
ax[3].axis(False);
