Generating fibrous mats#
In this notebook, we’re learning how to use porespy.generators.cylinders method to generate images that mimic fibrous mats.
import time

import matplotlib.pyplot as plt
import numpy as np

import porespy as ps

ps.visualization.set_mpl_style()
np.random.seed(5)
ps.settings.tqdm["disable"] = True
The cylinders function works either by providing the number of cylinders or the target porosity. If the number of cylinders is given, the function tries to fit in that many cylinders in a bounding box defined by its shape.
When providing porosity, the function works by estimating the number of cylinders needed to be inserted into the domain by estimating cylinder length, and exploiting the fact that, when inserting any potentially overlapping objects randomly into a volume v_total (which has units of pixels and is equal to dimx x dimy x dimz, for example), such that the total volume of objects added to the volume is v_added (and includes any volume that was inserted but overlapped with already occupied space), the resulting porosity will be equal to:
After intially estimating the cylinder number and inserting a small fraction of the estimated number, the true cylinder volume is calculated, the estimate refined, and a larger fraction of cylinderss inserted. This is repeated a number of times according to the maxiter argument, yielding an image with a porosity close to the goal.
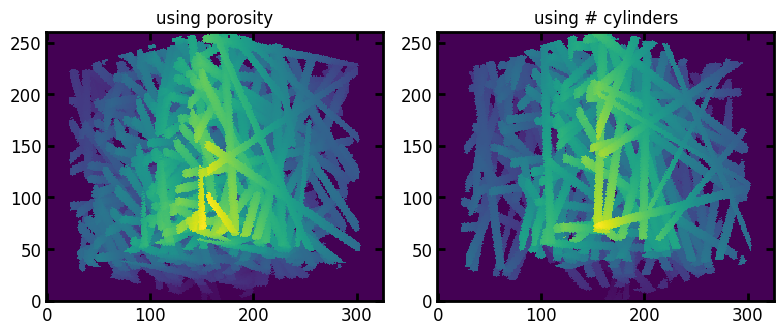
This first example shows that the output images are similar to the output of cylinders when providing the number of cylinders (for an image with the same number of cylinders), and that the goal porosity is reached.
dim = 200
shape = [dim, dim, dim]
radius = 4
phi_max = 0
theta_max = 90
length = None
maxiter = 3
target_porosity = 0.8
Let’s first store the generic arguments in a dictionary so we can easily pass it to cylinders method.
params_generic = {
    "shape": shape,
    "r": radius,
    "phi_max": phi_max,
    "theta_max": theta_max,
    "length": length,
    "maxiter": maxiter,
}
Generate image by providing the target porosity:
im_using_porosity = ps.generators.cylinders(**params_generic, porosity=target_porosity)
print(f"Output porosity is {ps.metrics.porosity(im_using_porosity)}.")
Output porosity is 0.798974125.
Now generate another image by providing the number of cylinders rather than porosity.
im_using_ncylinders = ps.generators.cylinders(**params_generic, ncylinders=293)
three_d1 = ps.visualization.show_3D(im_using_porosity)
three_d2 = ps.visualization.show_3D(im_using_ncylinders)
fig, ax = plt.subplots(1, 2, figsize=[8, 4])
ax[0].imshow(three_d1)
ax[1].imshow(three_d2)
ax[0].set_title("using porosity")
ax[1].set_title("using # cylinders");

This next block shows that the time penalty over inserting the same number of fibers using generators.cylinders is about 2x, and the time penalty ratio increases with requested porosity, when image generation is faster anyway.
porosity_target = [0.1, 0.4, 0.8, 0.95]
porosity_actual = []
runtime_ratios = []
runtime_porosity = []
runtime_ncylinder = []

for eps in porosity_target:
    temp = time.time()
    im = ps.generators.cylinders(**params_generic, porosity=eps)
    runtime_porosity.append(time.time() - temp)
    porosity_actual.append(ps.metrics.porosity(im))
---------------------------------------------------------------------------
KeyboardInterrupt                         Traceback (most recent call last)
Cell In[7], line 9
      7 for eps in porosity_target:
      8     temp = time.time()
----> 9     im = ps.generators.cylinders(**params_generic, porosity=eps)
     10     runtime_porosity.append(time.time() - temp)
     11     porosity_actual.append(ps.metrics.porosity(im))

File ~/work/porespy/porespy/src/porespy/generators/_imgen.py:1495, in cylinders(shape, r, ncylinders, porosity, phi_max, theta_max, length, maxiter, seed)
   1493 n_fibers = int(np.ceil(frac * n_fibers_total) - n_fibers_added)
   1494 if n_fibers > 0:
-> 1495     tmp = _cylinders(shape, r, n_fibers,
   1496                      phi_max, theta_max, length,
   1497                      verbose=False)
   1498     im = im * tmp
   1499 n_fibers_added += n_fibers

File ~/work/porespy/porespy/src/porespy/generators/_imgen.py:1341, in _cylinders(shape, r, ncylinders, phi_max, theta_max, length, verbose, seed)
   1339 crds = line_segment(X0, X1)
   1340 lower = ~np.any(np.vstack(crds).T < [L, L, L], axis=1)
-> 1341 upper = ~np.any(np.vstack(crds).T >= shape + L, axis=1)
   1342 valid = upper * lower
   1343 if np.any(valid):

File ~/work/porespy/porespy/.venv/lib/python3.13/site-packages/numpy/_core/fromnumeric.py:2580, in any(a, axis, out, keepdims, where)
   2477 @array_function_dispatch(_any_dispatcher)
   2478 def any(a, axis=None, out=None, keepdims=np._NoValue, *, where=np._NoValue):
   2479     """
   2480     Test whether any array element along a given axis evaluates to True.
   2481
   (...)   2578
   2579     """
-> 2580     return _wrapreduction_any_all(a, np.logical_or, 'any', axis, out,
   2581                                   keepdims=keepdims, where=where)

File ~/work/porespy/porespy/.venv/lib/python3.13/site-packages/numpy/_core/fromnumeric.py:91, in _wrapreduction_any_all(obj, ufunc, method, axis, out, **kwargs)
     89 def _wrapreduction_any_all(obj, ufunc, method, axis, out, **kwargs):
     90     # Same as above function, but dtype is always bool (but never passed on)
---> 91     passkwargs = {k: v for k, v in kwargs.items()
     92                   if v is not np._NoValue}
     94     if type(obj) is not mu.ndarray:
     95         try:

KeyboardInterrupt:
# The number of cylinders added during the previous phase
ncylinders = [3033, 1143, 294, 75]

for ncylinder in ncylinders:
    temp = time.time()
    im = ps.generators.cylinders(**params_generic, ncylinders=ncylinder)
    runtime_ncylinder.append(time.time() - temp)

runtime_ratios = [t1 / t2 for (t1, t2) in zip(runtime_porosity, runtime_ncylinder)]
fig, ax = plt.subplots(1, 2, figsize=(8, 4))

ax[0].plot(porosity_target, runtime_ncylinder, "o-", label="using # cylinders")
ax[0].plot(porosity_target, runtime_porosity, "o-", label="using porosity")
ax[0].set_xlabel("target porosity")
ax[0].set_ylabel("duration [sec]")
ax[0].legend()

ax[1].scatter(porosity_target, porosity_actual)
ax[1].plot(porosity_target, porosity_target, "g--")
ax[1].set_xlabel("target porosity")
ax[1].set_ylabel("attained porosity");
Lastly, this block shows that more iterations improves proximity to goal porosity.
porosity_target = 0.85
porosity_actual = []
maxiter = range(0, 10)

for m in maxiter:
    # Update maxiter in params_generic
    params_generic.update({"maxiter": m})
    im = ps.generators.cylinders(**params_generic, porosity=porosity_target)
    porosity_actual.append(ps.metrics.porosity(im))
fig, ax = plt.subplots(figsize=(5, 4))
ax.plot(maxiter, porosity_actual, "o-")
ax.set_xlabel("Number of iterations")
ax.set_ylabel("Obtained porosity")
ax.set_ylim((0.7, 1));
