voronoi_edges#
import matplotlib.pyplot as plt
import numpy as np
import porespy as ps
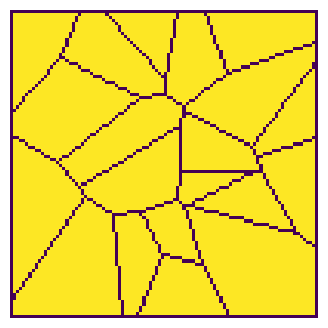
shape#
The image can be 2D and 3D
shape = [100, 100]
ncells = 20
im = ps.generators.voronoi_edges(shape=shape, ncells=ncells)
fig, ax = plt.subplots(figsize=[4, 4])
ax.imshow(im, origin="lower", interpolation="none")
ax.axis(False);
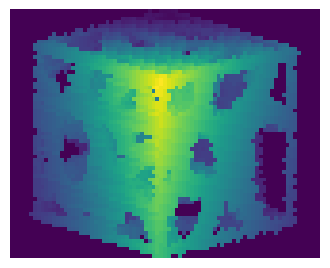
shape = [50, 50, 50]
ncells = 40
im = ps.generators.voronoi_edges(shape=shape, r=3, ncells=ncells)
fig, ax = plt.subplots(figsize=[4, 4])
ax.imshow(ps.visualization.show_3D(im), interpolation="none")
ax.axis(False);
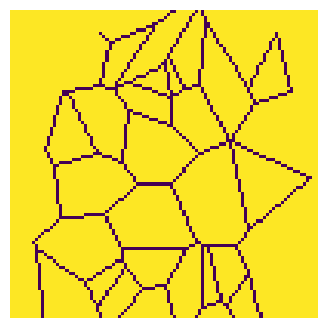
flat_faces#
By default the image will have voronoi edges laying on the image faces. This is accomplished by reflecting the points along each axis before running the tessellation. This can be disabled by setting flat_faces=False, but note that edges pointing to infinity are not drawn.
shape = [100, 100]
flat_faces = False
im = ps.generators.voronoi_edges(shape=shape, ncells=ncells, flat_faces=flat_faces)
fig, ax = plt.subplots(figsize=[4, 4])
ax.imshow(im, origin="lower", interpolation="none")
ax.axis(False);
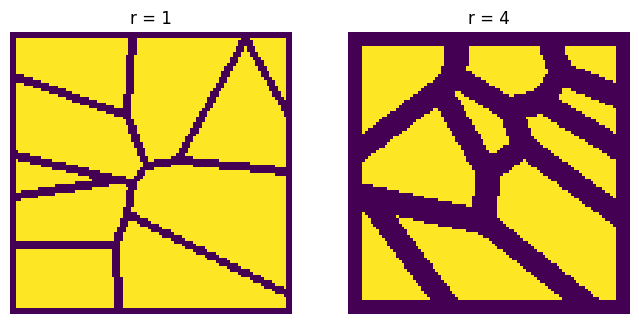
r#
The thickness or radius of the edges. By default they are 1 pixel thick, but can be made fatter by setting r > 0.
fig, ax = plt.subplots(1, 2, figsize=[8, 4])

r = 1
ncells = 10
im1 = ps.generators.voronoi_edges(shape=shape, r=r, ncells=ncells)
ax[0].imshow(im1, origin="lower", interpolation="none")
ax[0].set_title(f"r = {r}")
ax[0].axis(False)

r = 4
im2 = ps.generators.voronoi_edges(shape=shape, r=r, ncells=ncells)
ax[1].imshow(im2, origin="lower", interpolation="none")
ax[1].set_title(f"r = {r}")
ax[1].axis(False);
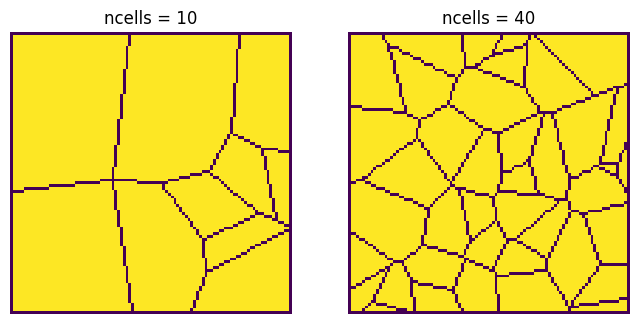
ncells#
The number of Voronoi cells to add
fig, ax = plt.subplots(1, 2, figsize=[8, 4])

ncells = 10
im1 = ps.generators.voronoi_edges(shape=shape, ncells=ncells)
ax[0].imshow(im1, origin="lower", interpolation="none")
ax[0].set_title(f"ncells = {ncells}")
ax[0].axis(False)

ncells = 40
im2 = ps.generators.voronoi_edges(shape=shape, ncells=ncells)
ax[1].imshow(im2, origin="lower", interpolation="none")
ax[1].set_title(f"ncells = {ncells}")
ax[1].axis(False);