random_cantor_dust#
This generates a fractal image by iteratively and randomaly removing segments at successively large scales.
import porespy as ps
import matplotlib.pyplot as plt
import numpy as np
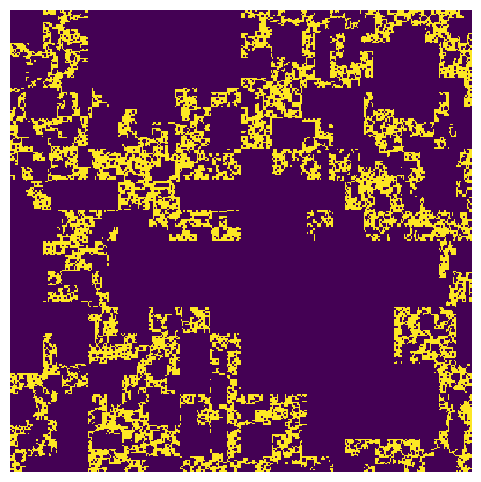
shape#
The shape of the image can either be 2D or 3D:
fig, ax = plt.subplots(1, 1, figsize=[6, 6])

im = ps.generators.random_cantor_dust(shape=[500, 500], n=8)
ax.imshow(im, interpolation="none")
ax.axis(False);
[03:59:04] WARNING Requested shape being changed to [512 512] _fractals.py:63
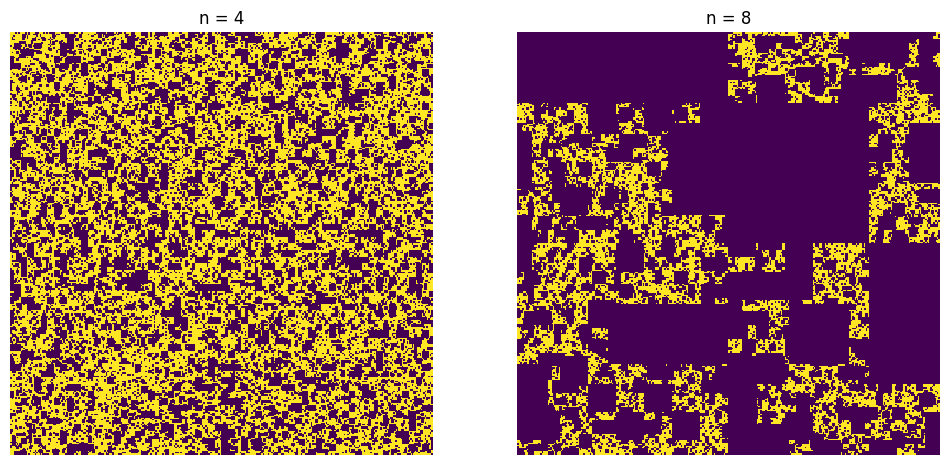
n#
The number of scales to bisect the image, with higher numbers leading to large features. The algorithm starts by dividing a p x p region and randomly setting some quadrants to False. It proceeds by increasing the region size and repeating. n controls the number of iterations at larger scales.
fig, ax = plt.subplots(1, 2, figsize=[12, 6])

n = 4
im = ps.generators.random_cantor_dust(shape=[500, 500], n=n)
ax[0].imshow(im, interpolation="none")
ax[0].axis(False)
ax[0].set_title(f"n = {n}")

n = 8
im = ps.generators.random_cantor_dust(shape=[500, 500], n=n)
ax[1].imshow(im, interpolation="none")
ax[1].axis(False)
ax[1].set_title(f"n = {n}");
WARNING Requested shape being changed to [512 512] _fractals.py:63
WARNING Requested shape being changed to [512 512] _fractals.py:63
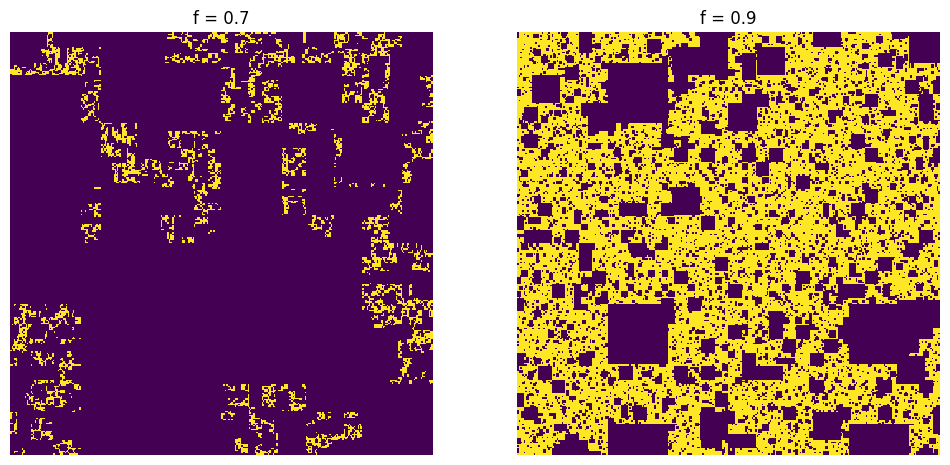
f#
The probability that a quadrant survives the process (i.e. set to True)
fig, ax = plt.subplots(1, 2, figsize=[12, 6])

f = 0.7
im = ps.generators.random_cantor_dust(shape=[500, 500], n=n, f=f)
ax[0].imshow(im, interpolation="none")
ax[0].axis(False)
ax[0].set_title(f"f = {f}")

f = 0.9
im = ps.generators.random_cantor_dust(shape=[500, 500], n=n, f=f)
ax[1].imshow(im, interpolation="none")
ax[1].axis(False)
ax[1].set_title(f"f = {f}");
WARNING Requested shape being changed to [512 512] _fractals.py:63
WARNING Requested shape being changed to [512 512] _fractals.py:63
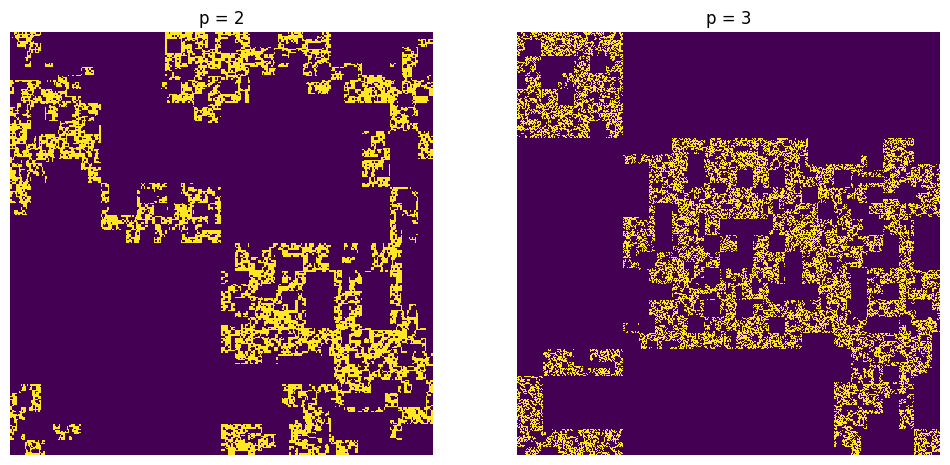
p#
The size of the initial region, which is scaled by a factor of p on each step
fig, ax = plt.subplots(1, 2, figsize=[12, 6])

p = 2
im = ps.generators.random_cantor_dust(shape=[500, 500], n=8, p=p)
ax[0].imshow(im, interpolation="none")
ax[0].axis(False)
ax[0].set_title(f"p = {p}")

p = 3
im = ps.generators.random_cantor_dust(shape=[500, 500], n=8, p=p)
ax[1].imshow(im, interpolation="none")
ax[1].axis(False)
ax[1].set_title(f"p = {p}");
[03:59:05] WARNING Requested shape being changed to [512 512] _fractals.py:63
WARNING Requested shape being changed to [6561 6561] _fractals.py:63