apply_padded#
Applies padding to an image before passing through specified function
import matplotlib.pyplot as plt
import numpy as np
import skimage
from edt import edt

import porespy as ps

ps.visualization.set_mpl_style()
im#
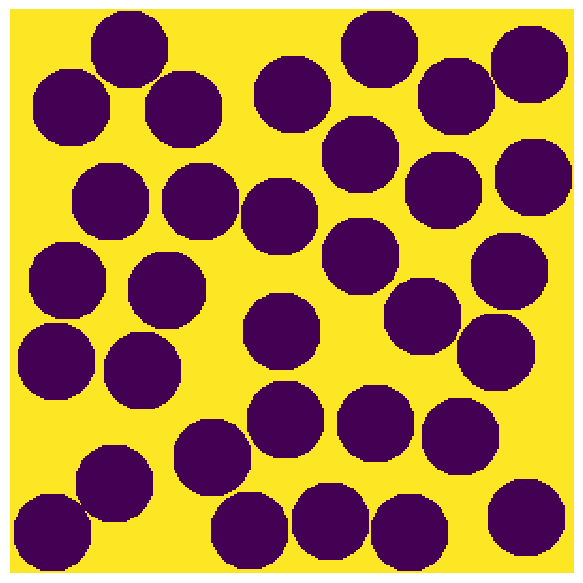
Generate a test image. Can be 2D or 3D image.
im = np.zeros([300, 300])
im = ps.generators.random_spheres(im=im, r=20, phi=0.6) == 0

plt.figure(figsize=[6, 6])
plt.axis(False)
plt.imshow(im);
func#
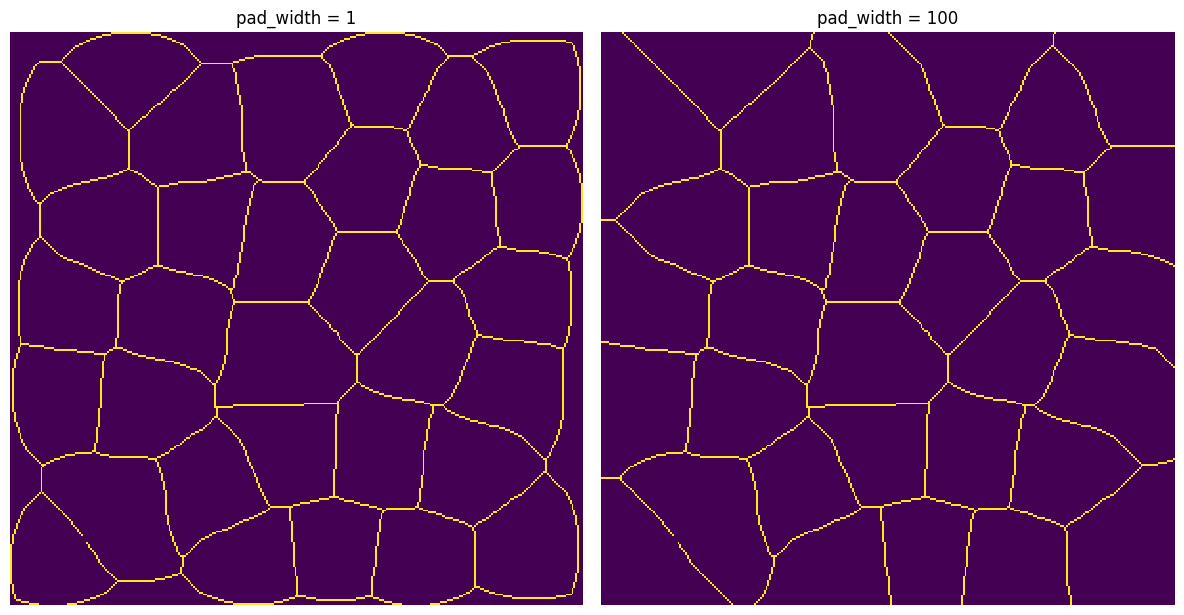
A good use case is skeletonize, which has edge artifacts that can be reduced if the image is pre-padded. It works on 2D or 3D images.
func = skimage.morphology.skeletonize
pad_width#
The amount of padding to add to each axis
x1 = ps.filters.apply_padded(im=im, pad_width=1, func=func, pad_val=1)
x2 = ps.filters.apply_padded(im=im, pad_width=100, func=func, pad_val=1)

fig, ax = plt.subplots(1, 2, figsize=[12, 12])
ax[0].imshow(x1)
ax[0].axis(False)
ax[0].set_title("pad_width = 1")
ax[1].imshow(x2)
ax[1].axis(False)
ax[1].set_title("pad_width = 100");
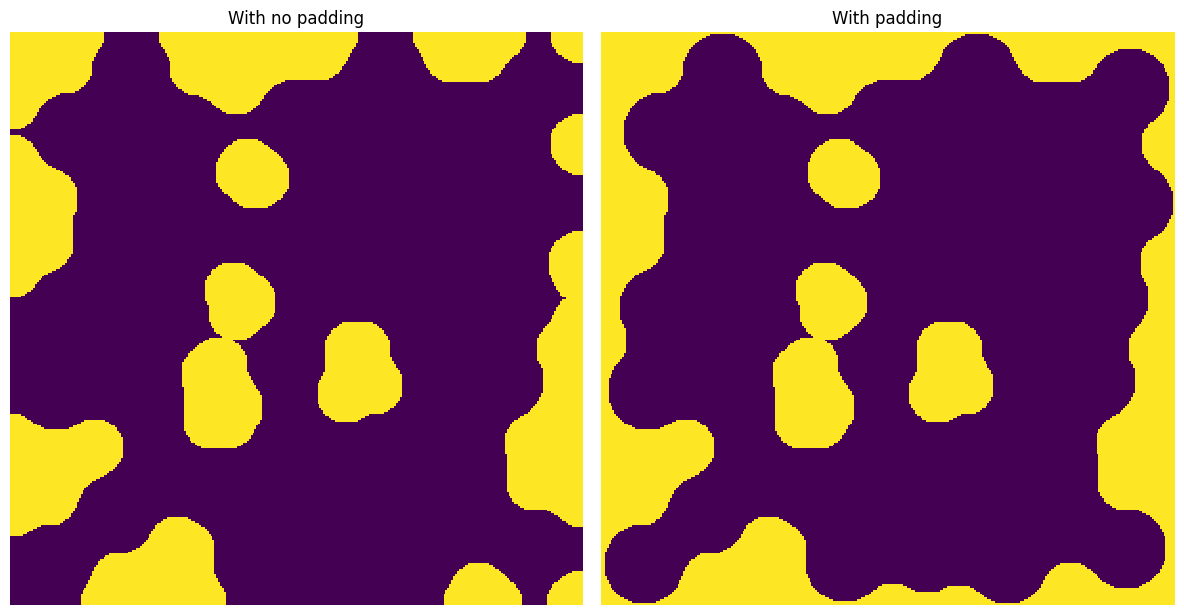
It’s also useful for morphological operations such as binary_opening
func = skimage.morphology.binary_opening
x3 = ps.filters.apply_padded(
    im=im, pad_width=0, func=func, pad_val=1, footprint=ps.tools.ps_disk(15)
)
x4 = ps.filters.apply_padded(
    im=im, pad_width=50, func=func, pad_val=1, footprint=ps.tools.ps_disk(15)
)

fig, ax = plt.subplots(1, 2, figsize=[12, 12])
ax[0].imshow(x3)
ax[0].axis(False)
ax[0].set_title("With no padding")
ax[1].imshow(x4)
ax[1].axis(False)
ax[1].set_title("With padding");
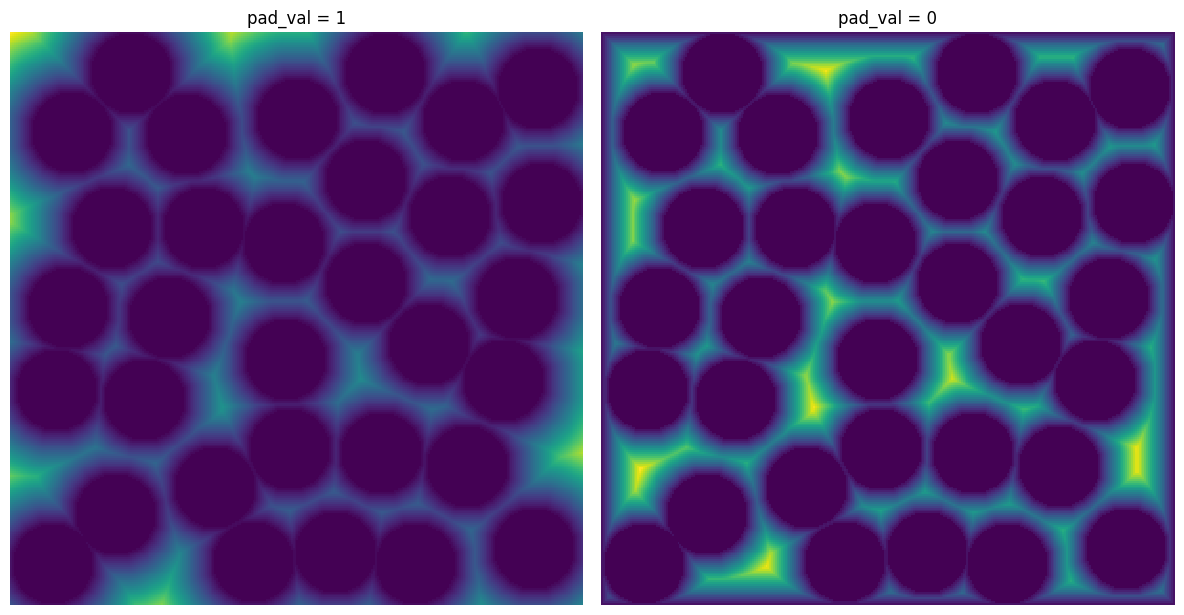
pad_val#
The value to be placed in padded voxels. It is almost always 1 but setting to 0 may be useful for applying a distance transform.
func = edt
x5 = ps.filters.apply_padded(im=im, pad_width=10, func=func, pad_val=1)
x6 = ps.filters.apply_padded(im=im, pad_width=10, func=func, pad_val=0)

fig, ax = plt.subplots(1, 2, figsize=[12, 12])
ax[0].imshow(x5)
ax[0].axis(False)
ax[0].set_title("pad_val = 1")
ax[1].imshow(x6)
ax[1].axis(False)
ax[1].set_title("pad_val = 0");