bar#
This method is a wrapper for matplotlib’s bar function with additional default settings to visualize a histogram of data.
import inspect

import numpy as np

import porespy as ps

ps.visualization.set_mpl_style()
inspect.signature(ps.visualization.bar)
<Signature (results, h='pdf', **kwargs)>
results#
This is the object returned by porespy’s functions in porespy.metrics. Examples of those functions are pore_size_distribution, radial_density_distribution, etc.
np.random.seed(10)
im = ps.generators.blobs(shape=[500, 500])
im = ps.filters.porosimetry(im)
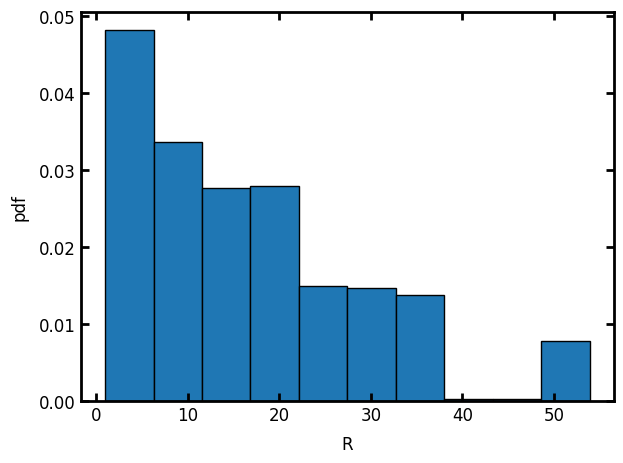
results = ps.metrics.pore_size_distribution(im=im, log=False)
ps.visualization.bar(results)
(<Figure size 640x480 with 1 Axes>, <Axes: xlabel='R', ylabel='pdf'>)
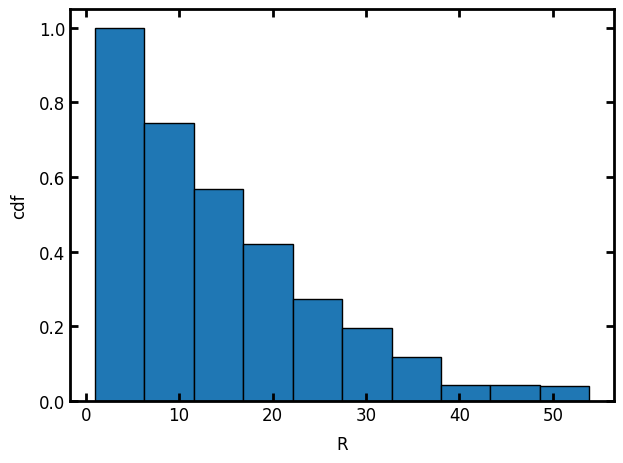
h#
The value to use for bin heights. The default is pdf. Depending on the porespy’s metrics function used for generating the results there may be different options for bin heights such as cdf, etc.
ps.visualization.bar(results, h="cdf")
(<Figure size 640x480 with 1 Axes>, <Axes: xlabel='R', ylabel='cdf'>)
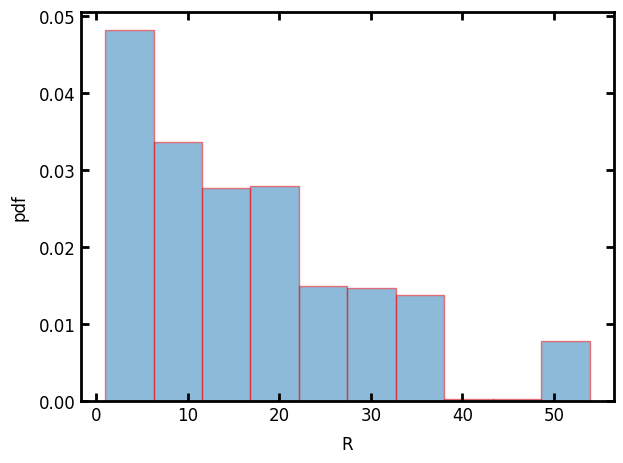
**kwargs#
Any keyword argument to specify user-defined changes on the histogram (For example edgecolor for changing the default black edge, alpha for tranparency, etc). Note that the keywords must be acceptable keywords by matplotlib’s bar method.
ps.visualization.bar(results, edgecolor="r", alpha=0.5)
(<Figure size 640x480 with 1 Axes>, <Axes: xlabel='R', ylabel='pdf'>)