regionprops_3D#
This is similar to the regionprops in scikit-image but has some extra features that are relevant to 3D images. Note that the scikit-image version has been adding 3D capabilities, make the PoreSpy version less useful.
import matplotlib.pyplot as plt
import scipy.ndimage as spim

import porespy as ps

ps.visualization.set_mpl_style()
im = ps.generators.random_spheres(shape=[80, 80, 80], r=10, clearance=3)

fig, ax = plt.subplots(figsize=[4, 4])
ax.imshow(im[20, ...], origin="lower", interpolation="none")
ax.axis(False);

We need to label each sphere so they are recognized as individual regions:
regions = spim.label(im)[0]

fig, ax = plt.subplots(figsize=[4, 4])
ax.imshow(regions[20, ...], origin="lower", interpolation="none")
ax.axis(False);

props = ps.metrics.regionprops_3D(regions)
props is a list of RegionProperties objects, subclassed from scikit-image. Each RegionProperties object possess the properties as attributes. Note that these are calculated on demand, so the regionsprops_3D function appears very quick, but the work has not yet been done.
props
[<porespy.metrics._regionprops.RegionPropertiesPS at 0x7fe390e09160>,
 <porespy.metrics._regionprops.RegionPropertiesPS at 0x7fe391466990>,
 <porespy.metrics._regionprops.RegionPropertiesPS at 0x7fe3913e2c10>,
 <porespy.metrics._regionprops.RegionPropertiesPS at 0x7fe390dce190>,
 <porespy.metrics._regionprops.RegionPropertiesPS at 0x7fe390dce060>,
 <porespy.metrics._regionprops.RegionPropertiesPS at 0x7fe390da6c30>,
 <porespy.metrics._regionprops.RegionPropertiesPS at 0x7fe3910718c0>,
 <porespy.metrics._regionprops.RegionPropertiesPS at 0x7fe391071370>,
 <porespy.metrics._regionprops.RegionPropertiesPS at 0x7fe3913bae50>,
 <porespy.metrics._regionprops.RegionPropertiesPS at 0x7fe3f02a0450>,
 <porespy.metrics._regionprops.RegionPropertiesPS at 0x7fe390dc8aa0>,
 <porespy.metrics._regionprops.RegionPropertiesPS at 0x7fe3f041b890>,
 <porespy.metrics._regionprops.RegionPropertiesPS at 0x7fe39137cd70>,
 <porespy.metrics._regionprops.RegionPropertiesPS at 0x7fe39137f930>,
 <porespy.metrics._regionprops.RegionPropertiesPS at 0x7fe3913368f0>,
 <porespy.metrics._regionprops.RegionPropertiesPS at 0x7fe390dae510>,
 <porespy.metrics._regionprops.RegionPropertiesPS at 0x7fe390dac7d0>,
 <porespy.metrics._regionprops.RegionPropertiesPS at 0x7fe390dae2d0>]
The properties of regions 1 are on the RegionsProperties object located at position 0 in the props list:
for d in dir(props[0]):
    if not d.startswith("_"):
        print(d)
area
area_bbox
area_convex
area_filled
axis_major_length
axis_minor_length
bbox
bbox_volume
border
centroid
centroid_local
centroid_weighted
centroid_weighted_local
convex_volume
coords
coords_scaled
dt
eccentricity
equivalent_diameter_area
euler_number
extent
feret_diameter_max
image
image_convex
image_filled
image_intensity
inertia_tensor
inertia_tensor_eigvals
inscribed_sphere
intensity_max
intensity_mean
intensity_min
intensity_std
label
mask
moments
moments_central
moments_hu
moments_normalized
moments_weighted
moments_weighted_central
moments_weighted_hu
moments_weighted_normalized
num_pixels
orientation
perimeter
perimeter_crofton
skeleton
slice
slices
solidity
sphericity
surface_area
surface_mesh_simplices
surface_mesh_vertices
volume
Let’s check a few of the properties:
print(props[0].volume)
5497.0
Because the present function is meant for 3D images, we have added specific terminology, like volume, instead of allowing area to mean volume like the scikit-image version”
print(props[0].area)
5497.0
We do have a surface_area, which is also specific to 3D objects:
print(props[0].surface_area)
1407.9961
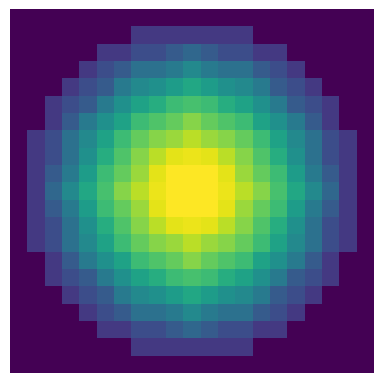
In addition to scalar metrics, we also provide access to useful images of the region:
fig, ax = plt.subplots(figsize=[4, 4])
ax.imshow(props[0].dt[5, ...])
ax.axis(False);