polydisperse_spheres#
Overlapping spheres with a distribution of sizes
import matplotlib.pyplot as plt
import numpy as np
import porespy as ps
import scipy.stats as spst
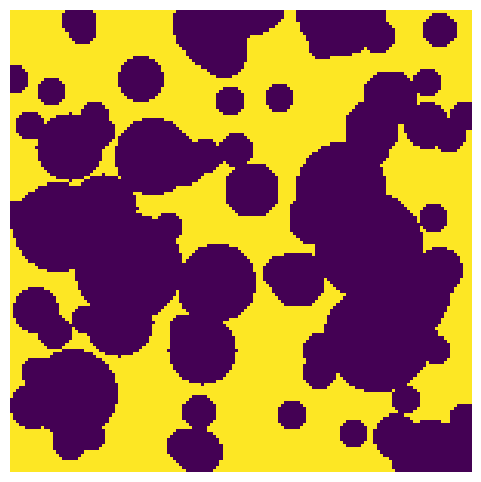
shape#
Images can be 2D or 3D.
shape = [150, 150]
porosity = 0.5
dist = spst.norm(loc=10, scale=5)
im = ps.generators.polydisperse_spheres(shape=shape, porosity=porosity, dist=dist, seed=10)

fig, ax = plt.subplots(1, 1, figsize=[6, 6])
ax.imshow(im, interpolation="none", origin="lower")
ax.axis(False);
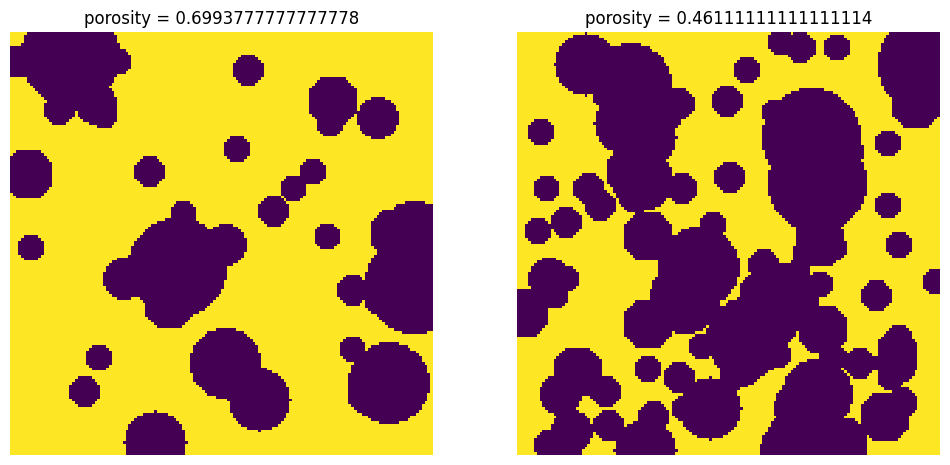
porosity#
Porosity controls how many spheres are added. The algorithms for determining the number of spheres to add is not very sophisticated, so the actual porosity is not perfect.
fig, ax = plt.subplots(1, 2, figsize=[12, 6])

porosity = 0.75
im1 = ps.generators.polydisperse_spheres(shape=shape, porosity=porosity, dist=dist)
ax[0].imshow(im1, interpolation="none", origin="lower")
ax[0].set_title(f"porosity = {im1.sum() / im1.size}")
ax[0].axis(False)

porosity = 0.5
im2 = ps.generators.polydisperse_spheres(shape=shape, porosity=porosity, dist=dist)
ax[1].imshow(im2, interpolation="none", origin="lower")
ax[1].set_title(f"porosity = {im2.sum() / im2.size}")
ax[1].axis(False);
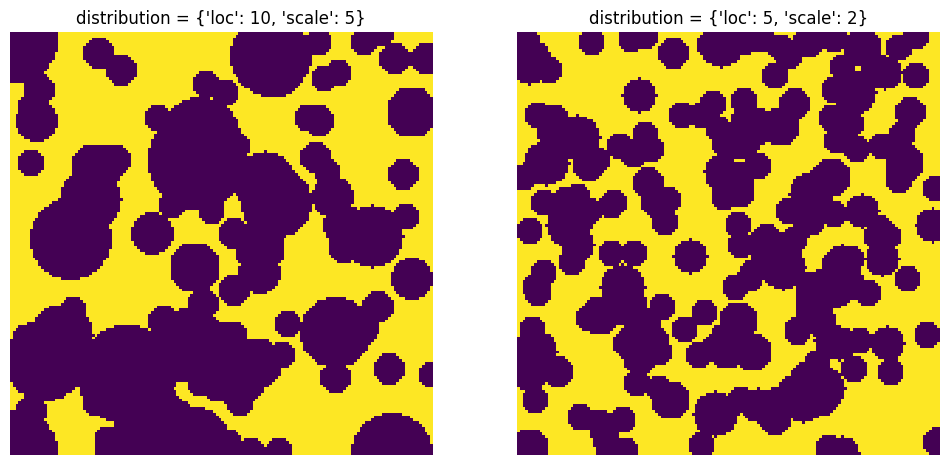
dist#
The statistical distribution from which sphere diameter should be drawn. This should be a handle to an initialized scipy.stats object:
fig, ax = plt.subplots(1, 2, figsize=[12, 6])

dist = spst.norm(loc=10, scale=5)
im1 = ps.generators.polydisperse_spheres(shape=shape, porosity=porosity, dist=dist)
ax[0].imshow(im1, interpolation="none", origin="lower")
ax[0].set_title(f"distribution = {dist.kwds}")
ax[0].axis(False)

dist = spst.norm(loc=5, scale=2)
im2 = ps.generators.polydisperse_spheres(shape=shape, porosity=porosity, dist=dist)
ax[1].imshow(im2, interpolation="none", origin="lower")
ax[1].set_title(f"distribution = {dist.kwds}")
ax[1].axis(False);
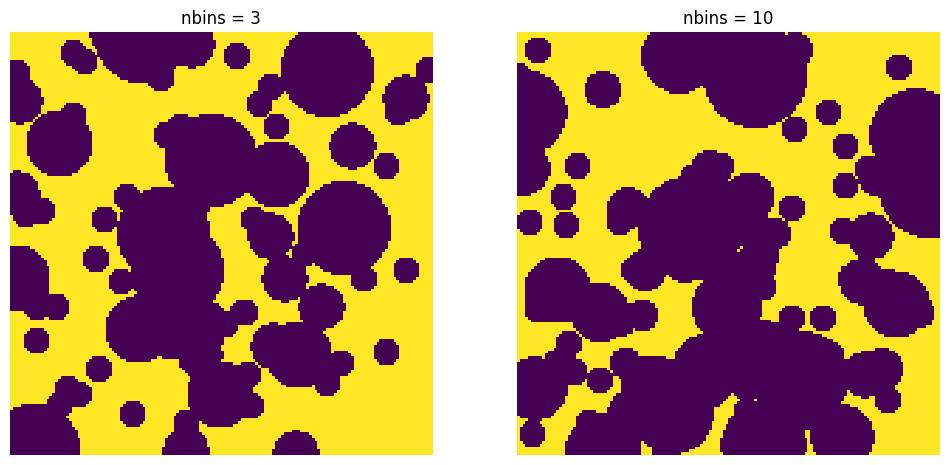
nbins#
Spheres must be generated with discrete sizes, so this controls how many unique sizes are used. The default is 5.
fig, ax = plt.subplots(1, 2, figsize=[12, 6])

dist = spst.norm(loc=10, scale=5)
nbins = 3
im1 = ps.generators.polydisperse_spheres(shape=shape, porosity=porosity, dist=dist, nbins=nbins)
ax[0].imshow(im1, interpolation="none", origin="lower")
ax[0].set_title(f"nbins = {nbins}")
ax[0].axis(False)

nbins = 10
im2 = ps.generators.polydisperse_spheres(shape=shape, porosity=porosity, dist=dist, nbins=nbins)
ax[1].imshow(im2, interpolation="none", origin="lower")
ax[1].set_title(f"nbins = {nbins}")
ax[1].axis(False);
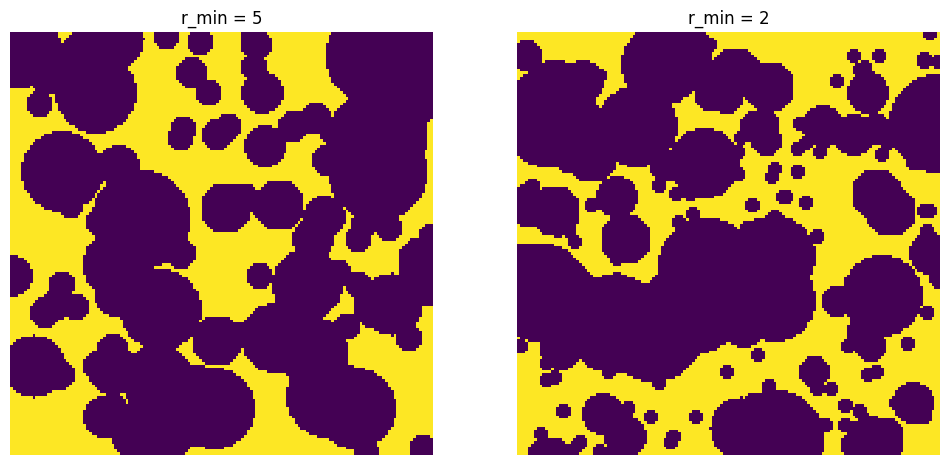
r_min#
The smallest sphere to generate, essentially limiting the size of the smallest bin. The default is 5.
fig, ax = plt.subplots(1, 2, figsize=[12, 6])

dist = spst.norm(loc=10, scale=5)
r_min = 5
im1 = ps.generators.polydisperse_spheres(shape=shape, porosity=porosity, dist=dist, r_min=r_min)
ax[0].imshow(im1, interpolation="none", origin="lower")
ax[0].set_title(f"r_min = {r_min}")
ax[0].axis(False)

r_min = 2
im2 = ps.generators.polydisperse_spheres(shape=shape, porosity=porosity, dist=dist, r_min=r_min)
ax[1].imshow(im2, interpolation="none", origin="lower")
ax[1].set_title(f"r_min = {r_min}")
ax[1].axis(False);