nphase_border#
Computes the number of phases that border on each pixel.
import matplotlib.pyplot as plt
import numpy as np
import porespy as ps

ps.visualization.set_mpl_style()
im#
This function works on both 2D and 3D images. If an im
matrix = ps.generators.blobs([200, 200])
inclusions = ps.generators.random_spheres(im=matrix, r=5, clearance=3)
bd = ps.filters.nphase_border(matrix * 1.0 + inclusions * 1.0)

fig, ax = plt.subplots(1, 2, figsize=[12, 6])
ax[0].imshow(matrix * 1.0 + inclusions * 1.0, origin="lower", interpolation="none")
ax[0].axis(False)
ax[1].imshow(bd, origin="lower", interpolation="none")
ax[1].axis(False);
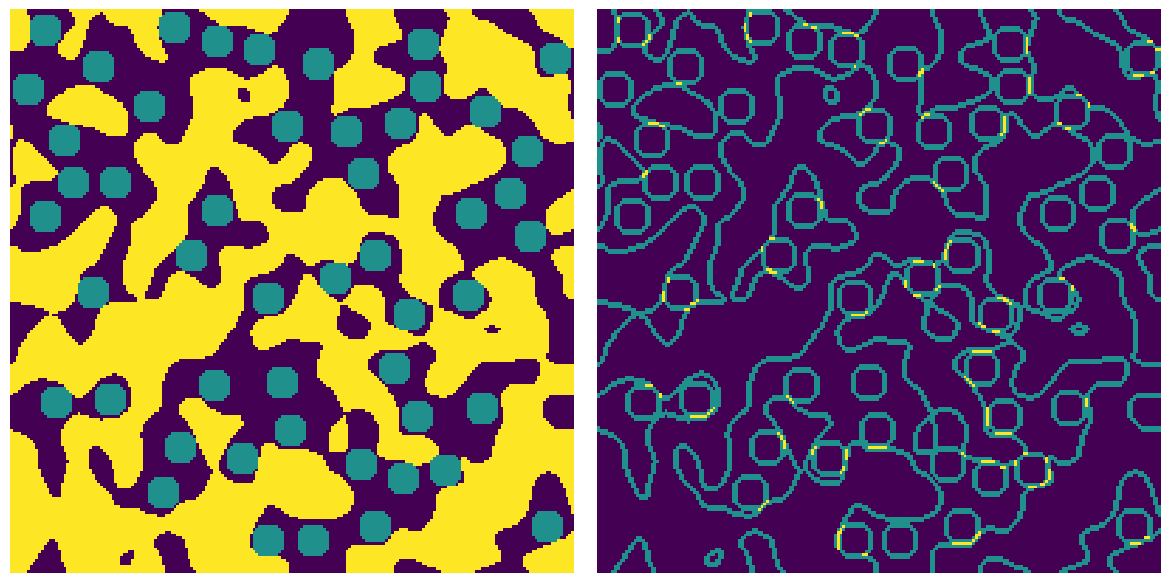
np.unique(bd)
array([1., 2., 3.])
The unique values in bd are 1, 2 and 3 indicating that some pixels border on 1 phase (internal pixels), 2 phases (edges) or 3 phases (corners where void, matrix and inclusion meet). Including diagonals results in a thicker border since more voxels are found that lie on an edge.
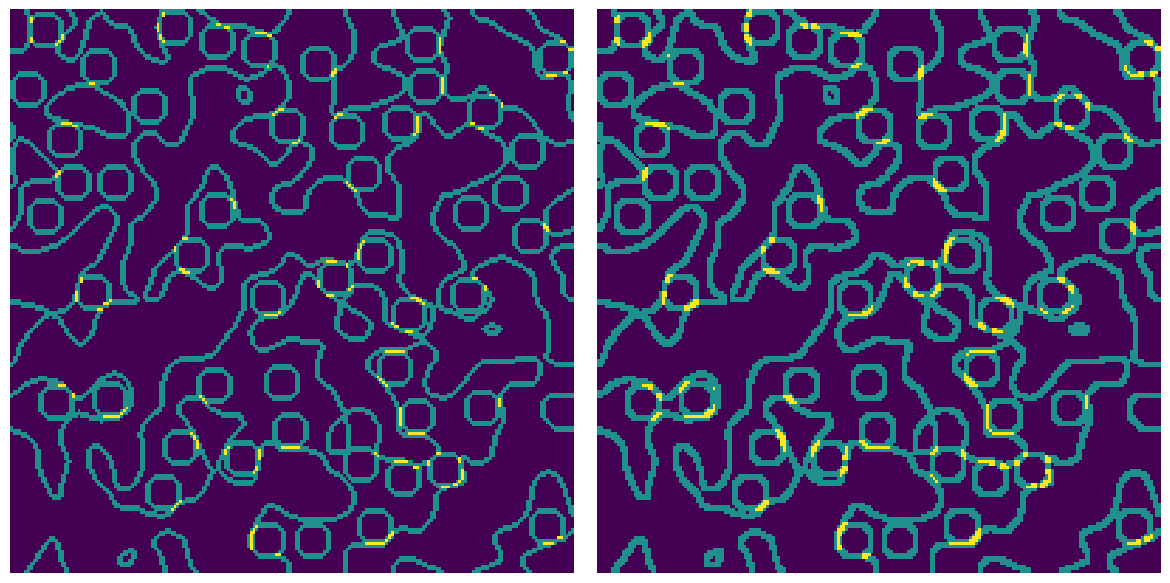
conn#
Controls how ‘connected’ a group of voxels must be. The options are 'min' which means voxels are only considered connected if they share a face, and 'max' which means voxels are connected if they share a face, edge or corner.
bd1 = ps.filters.nphase_border(matrix * 1.0 + inclusions * 1.0, conn="min")
bd2 = ps.filters.nphase_border(matrix * 1.0 + inclusions * 1.0, conn="max")

fig, ax = plt.subplots(1, 2, figsize=[12, 6])
ax[0].imshow(bd1, origin="lower", interpolation="none")
ax[0].axis(False)
ax[1].imshow(bd2, origin="lower", interpolation="none")
ax[1].axis(False);