apply_chords_3D#
Adds chords to the void space in all three principle directions. The chords are seprated by 1 voxel plus the provided spacing. Chords in the X, Y and Z directions are labelled 1, 2 and 3 resepctively.
import numpy as np
import porespy as ps
import scipy.ndimage as spim
import matplotlib.pyplot as plt

ps.visualization.set_mpl_style()
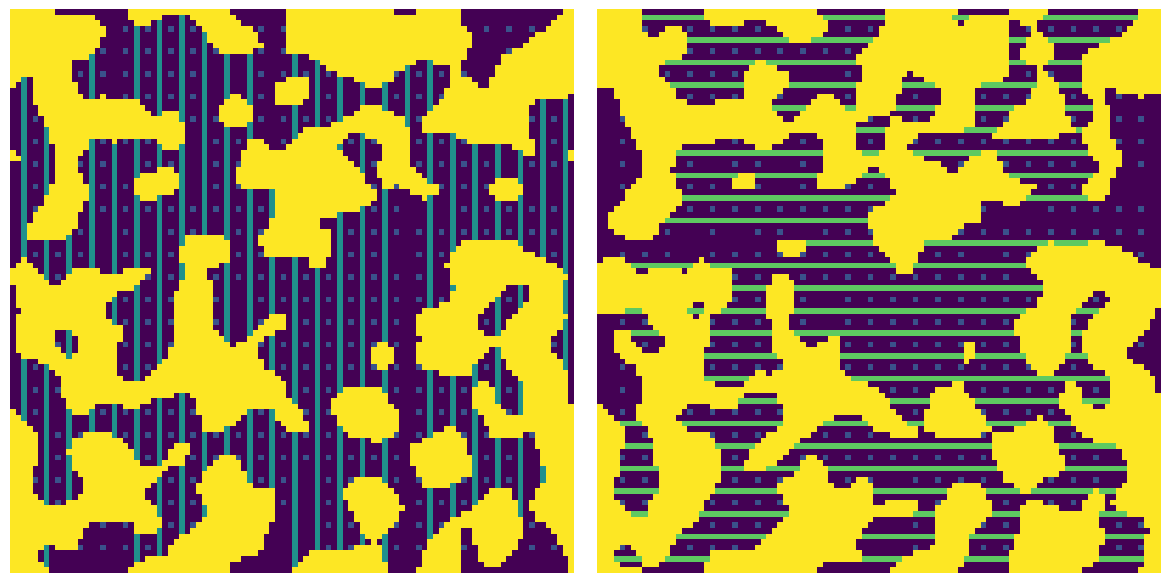
im#
The function takes a boolean image with True values indicating the void space, or phase of interest.
im = ps.generators.blobs(shape=[100, 100, 100])
chords = ps.filters.apply_chords_3D(im)

fig, ax = plt.subplots(1, 2, figsize=[12, 6])
ax[0].imshow(chords[20, ...] + ~im[20, ...] * 4)
ax[0].axis(False)
ax[1].imshow(chords[22, ...] + ~im[22, ...] * 4)
ax[1].axis(False);
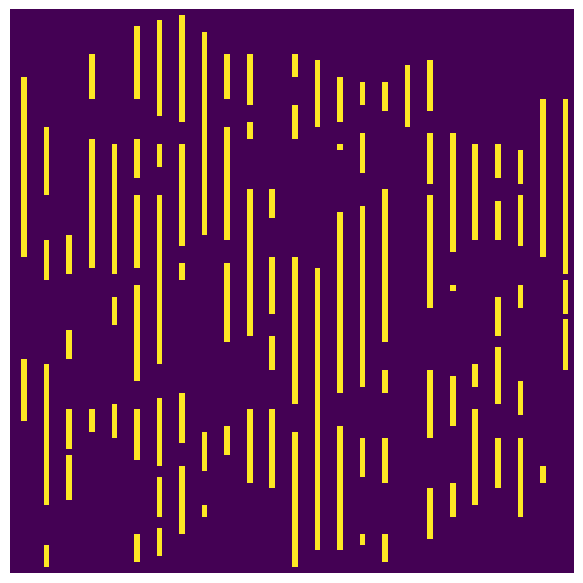
The chords in each direction are given different integer values so they can isolated by thresholding.
fig, ax = plt.subplots(1, 1, figsize=[6, 6])
ax.imshow(chords[20, ...] == 2)
ax.axis(False);
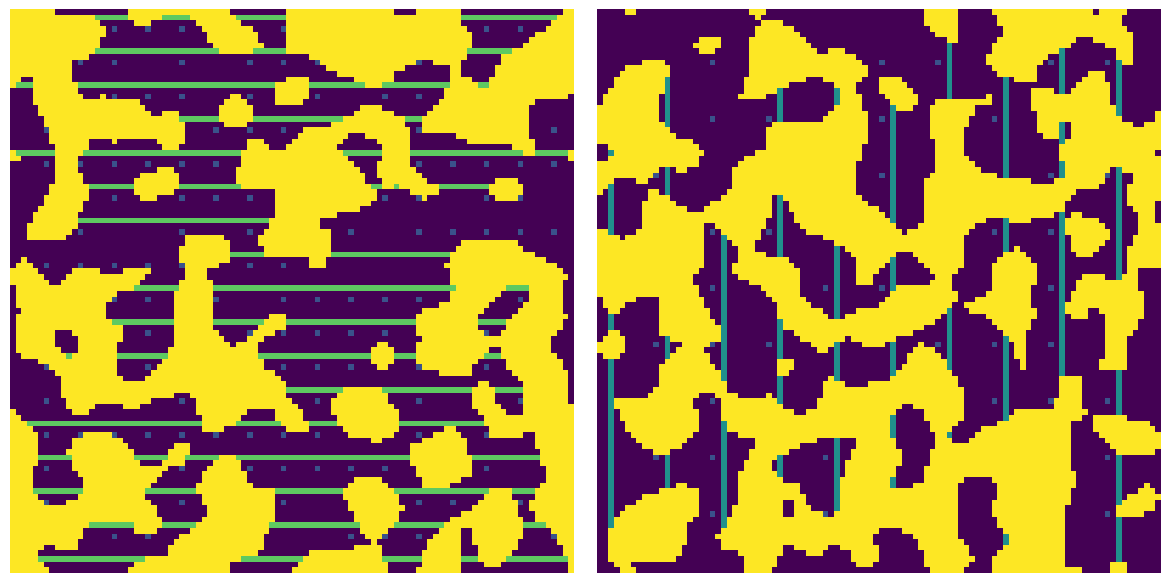
spacing#
By default the chords are drown with a spacing of 1 voxel between each orientation to provide the maximum number of chords. This can be adjusted to create few chords if the image is very large if needed.
c1 = ps.filters.apply_chords_3D(im, spacing=1)
c3 = ps.filters.apply_chords_3D(im, spacing=3)

fig, ax = plt.subplots(1, 2, figsize=[12, 6])
ax[0].imshow(c1[20, ...] + ~im[20, ...] * 4)
ax[0].axis(False)
ax[1].imshow(c3[30, ...] + ~im[30, ...] * 4)
ax[1].axis(False);
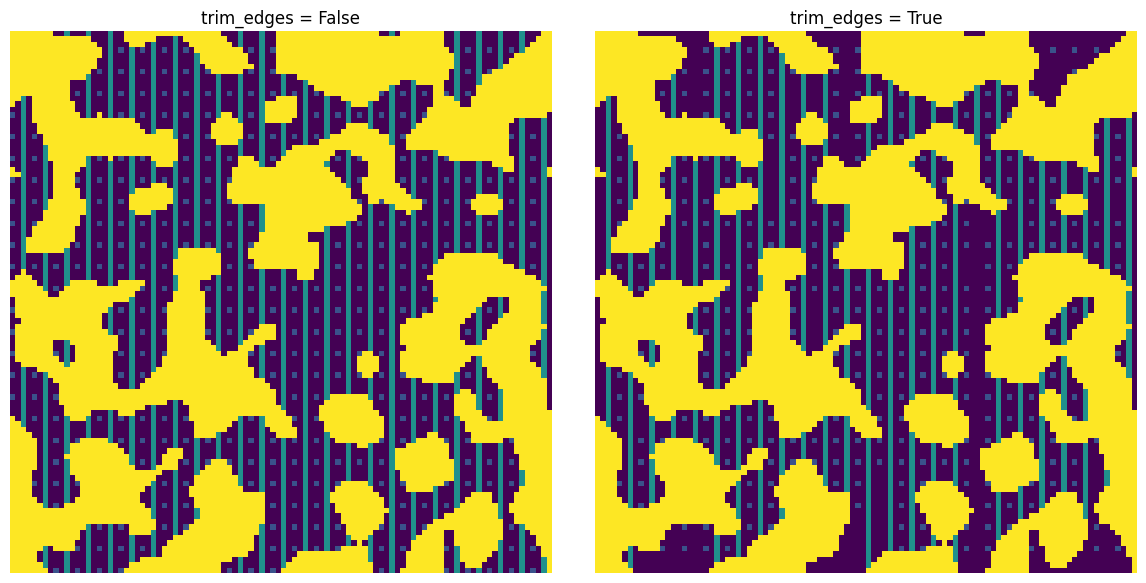
trim_edges#
c1 = ps.filters.apply_chords_3D(im, trim_edges=False)
c2 = ps.filters.apply_chords_3D(im, trim_edges=True)

fig, ax = plt.subplots(1, 2, figsize=[12, 6])
ax[0].imshow(c1[20, ...] + ~im[20, ...] * 4)
ax[0].axis(False)
ax[0].set_title("trim_edges = False")
ax[1].imshow(c2[20, ...] + ~im[20, ...] * 4)
ax[1].axis(False)
ax[1].set_title("trim_edges = True");