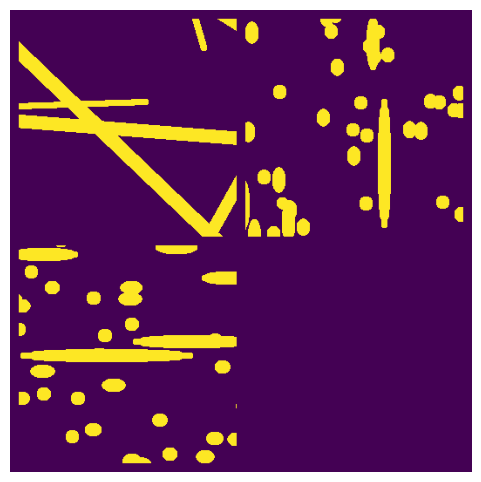
cylinders#
This creates a pile of overlapping cylinders, resembling fibrous mats.
import inspect

import matplotlib.pyplot as plt

import porespy as ps
shape#
The dimension of the image to create. This must be 3D since 2D overlapping cylinders don’t make much physical sense.
im = ps.generators.cylinders(shape=[250, 250, 250], r=8, ncylinders=100)

fig, ax = plt.subplots(1, 1, figsize=[6, 6])
ax.imshow(ps.visualization.show_planes(~im))
ax.axis(False);
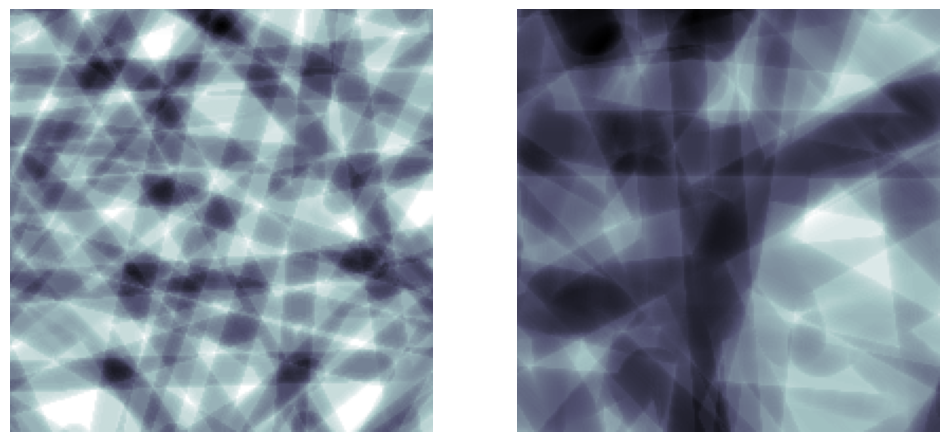
r#
The radius of the cylinders to add
fig, ax = plt.subplots(1, 2, figsize=[12, 6])

r = 8
im = ps.generators.cylinders(shape=[200, 200, 200], r=r, ncylinders=100)
ax[0].imshow(ps.visualization.xray(im, axis=2), cmap=plt.cm.bone)
ax[0].axis(False)

r = 16
im = ps.generators.cylinders(shape=[200, 200, 200], r=r, ncylinders=100)

ax[1].imshow(ps.visualization.xray(im, axis=2), cmap=plt.cm.bone)
ax[1].axis(False);
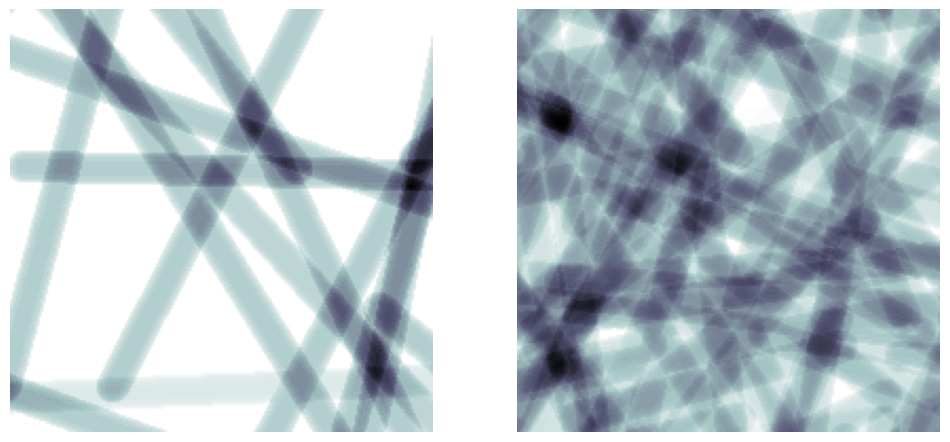
ncylinders#
Directly controls the number of cylinders that are added:
fig, ax = plt.subplots(1, 2, figsize=[12, 6])

r = 8
ncylinders = 25
im = ps.generators.cylinders(shape=[200, 200, 200], r=r, ncylinders=ncylinders)
ax[0].imshow(ps.visualization.xray(im, axis=2), cmap=plt.cm.bone)
ax[0].axis(False)

ncylinders = 100
im = ps.generators.cylinders(shape=[200, 200, 200], r=r, ncylinders=ncylinders)

ax[1].imshow(ps.visualization.xray(im, axis=2), cmap=plt.cm.bone)
ax[1].axis(False);
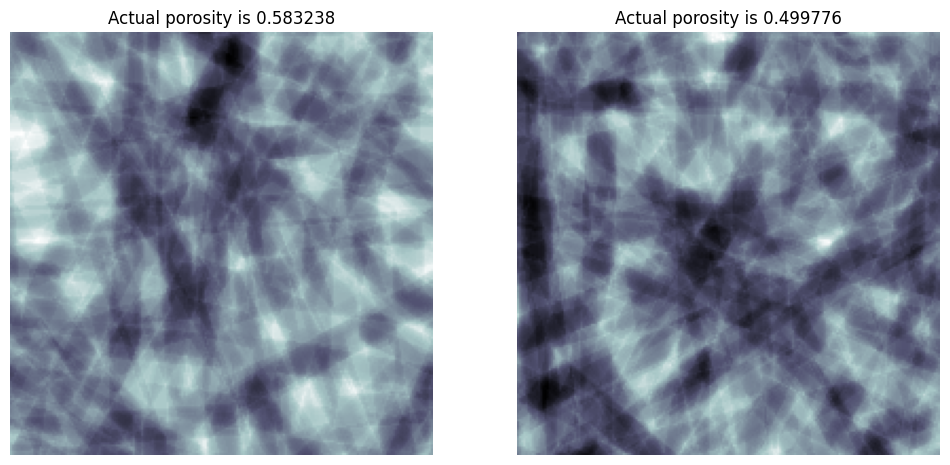
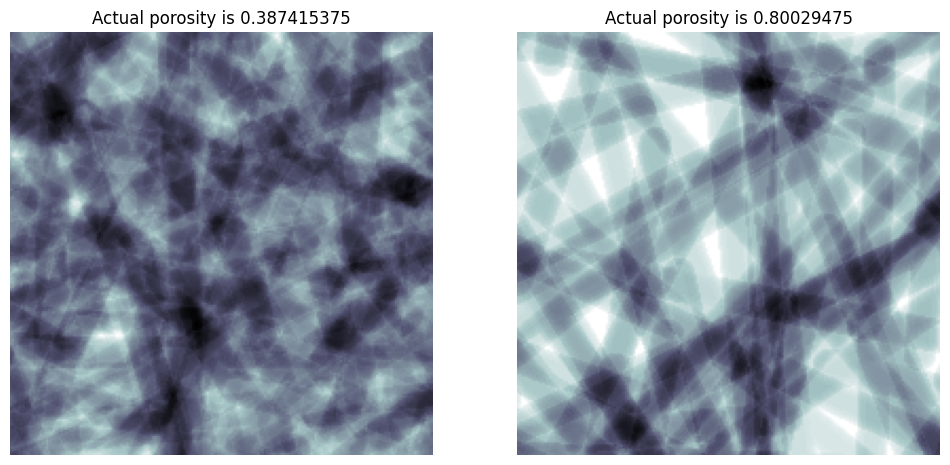
porosity#
Instead of specifying the number of cylinders, you can optional request a porosity which the function attempts to match iteratively:
fig, ax = plt.subplots(1, 2, figsize=[12, 6])

r = 8
porosity = 0.4
im = ps.generators.cylinders(shape=[200, 200, 200], r=r, porosity=porosity)
ax[0].imshow(ps.visualization.xray(im, axis=2), cmap=plt.cm.bone)
ax[0].axis(False)
ax[0].set_title(f"Actual porosity is {im.sum() / im.size}")

porosity = 0.8
im = ps.generators.cylinders(shape=[200, 200, 200], r=r, porosity=porosity)

ax[1].imshow(ps.visualization.xray(im, axis=2), cmap=plt.cm.bone)
ax[1].axis(False)
ax[1].set_title(f"Actual porosity is {im.sum() / im.size}");
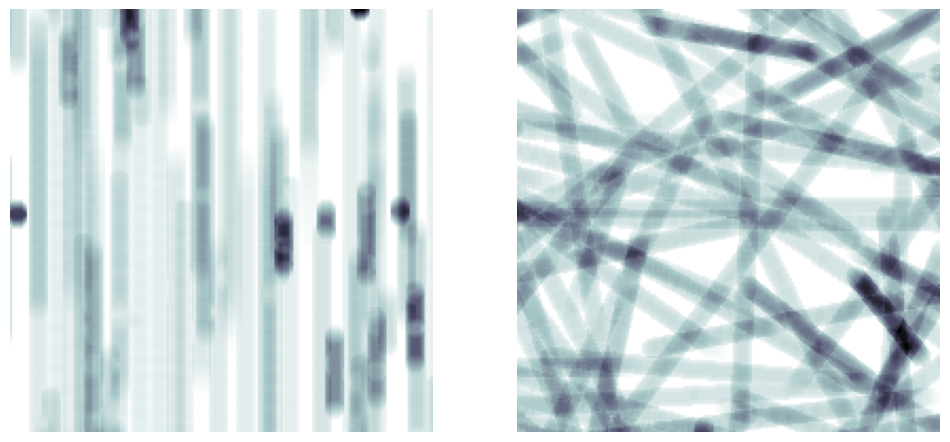
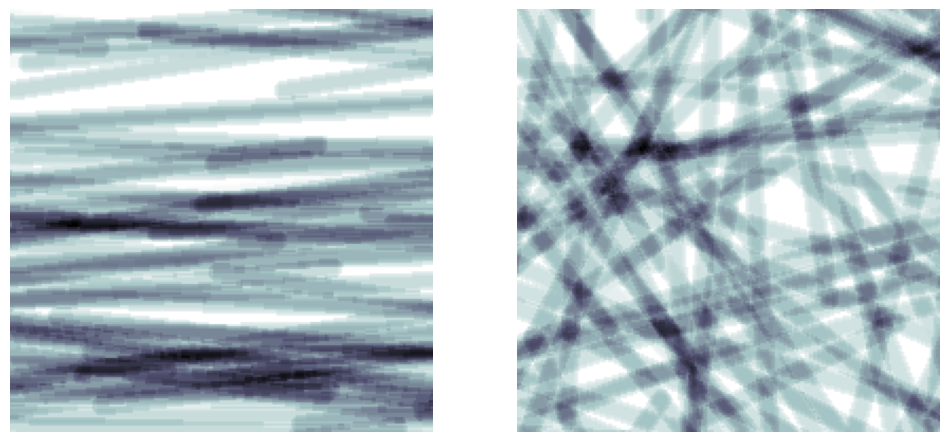
phi_max and theta_max#
Controls the amount of random rotation of the fibers. Orientations will be chosen randomly from between 0 and the given values.
fig, ax = plt.subplots(1, 2, figsize=[12, 6])

im = ps.generators.cylinders(shape=[200, 200, 200], r=5, ncylinders=100, phi_max=0)
ax[0].imshow(ps.visualization.xray(im, axis=0), cmap=plt.cm.bone)
ax[0].axis(False)

im = ps.generators.cylinders(shape=[200, 200, 200], r=5, ncylinders=100, phi_max=90)

ax[1].imshow(ps.visualization.xray(im, axis=0), cmap=plt.cm.bone)
ax[1].axis(False);
fig, ax = plt.subplots(1, 2, figsize=[12, 6])

im = ps.generators.cylinders(shape=[200, 200, 200], r=5, ncylinders=100, theta_max=10)
ax[0].imshow(ps.visualization.xray(im, axis=2), cmap=plt.cm.bone)
ax[0].axis(False)

im = ps.generators.cylinders(shape=[200, 200, 200], r=5, ncylinders=100, theta_max=90)

ax[1].imshow(ps.visualization.xray(im, axis=2), cmap=plt.cm.bone)
ax[1].axis(False);
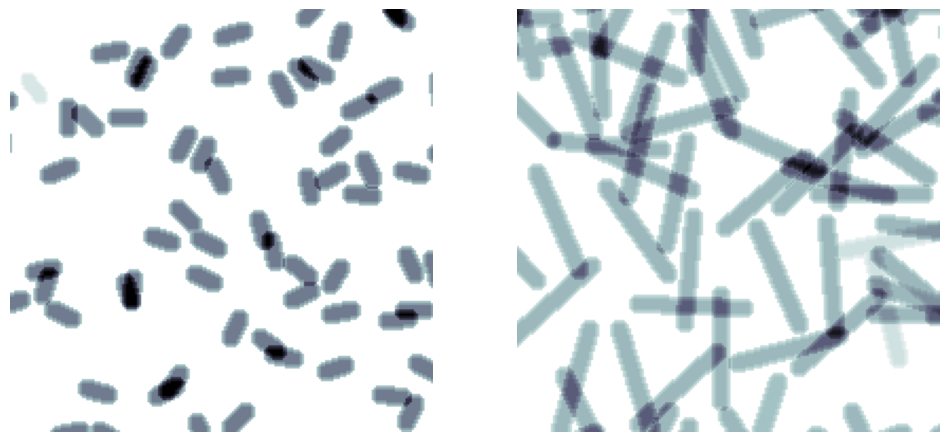
length#
Controls the length of the fibers. By default they always extend to the image edges, but they can be shortened.
fig, ax = plt.subplots(1, 2, figsize=[12, 6])

im = ps.generators.cylinders(shape=[200, 200, 200], r=5, ncylinders=100, length=10)
ax[0].imshow(ps.visualization.xray(im, axis=2), cmap=plt.cm.bone)
ax[0].axis(False)

im = ps.generators.cylinders(shape=[200, 200, 200], r=5, ncylinders=100, length=50)

ax[1].imshow(ps.visualization.xray(im, axis=2), cmap=plt.cm.bone)
ax[1].axis(False);
maxiter#
Controls how many iterations the function uses to match the requested porosity. If ncylinders is given instead of porosity, then maxiter is ignored. The default is 3, which is usually fine.
fig, ax = plt.subplots(1, 2, figsize=[12, 6])

porosity = 0.5
im = ps.generators.cylinders(shape=[200, 200, 200], r=8, porosity=porosity, maxiter=2)
ax[0].imshow(ps.visualization.xray(im, axis=2), cmap=plt.cm.bone)
ax[0].axis(False)
ax[0].set_title(f"Actual porosity is {im.sum() / im.size}")

im = ps.generators.cylinders(shape=[200, 200, 200], r=8, porosity=porosity, maxiter=5)

ax[1].imshow(ps.visualization.xray(im, axis=2), cmap=plt.cm.bone)
ax[1].axis(False)
ax[1].set_title(f"Actual porosity is {im.sum() / im.size}");