find_h#
Find the high of the two-phase zone in an invasion image
import matplotlib.pyplot as plt
import numpy as np

import porespy as ps

ps.visualization.set_mpl_style()
Start by performing a basic invasion simulation:
np.random.seed(1)
im = ps.generators.blobs(shape=[150, 150], porosity=0.6, blobiness=1.5, seed=7)
inlets = np.zeros_like(im)
inlets[0, :] = True
pc = ps.filters.capillary_transform(im, voxel_size=1, g=0)
inv = ps.simulations.drainage(im=im, inlets=inlets, pc=pc)
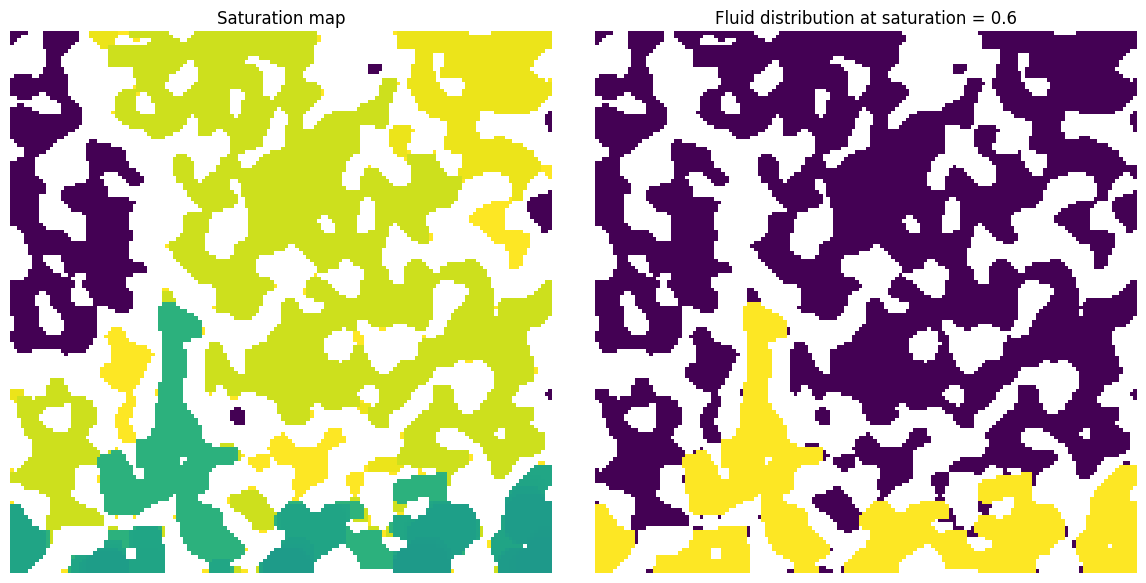
fig, ax = plt.subplots(1, 2, figsize=[12, 6])
ax[0].imshow(inv.im_snwp / im, interpolation="none", origin="lower")
ax[0].axis(False)
ax[0].set_title("Saturation map")
ax[1].imshow((inv.im_snwp < 0.6) * (inv.im_snwp > 0) / im, interpolation="none", origin="lower")
ax[1].axis(False)
ax[1].set_title("Fluid distribution at saturation = 0.6");
Next we need to find to convert the fluid configuration image into a saturation profile:
s_prof = ps.metrics.satn_profile(satn=inv.im_snwp, s=0.6)
plt.plot(s_prof.position, s_prof.saturation, "b-o")
plt.xlabel("distance from injection face")
plt.ylabel("non-wetting phase saturation");

Finally, we can determine the height of the two phase zone:
h = ps.metrics.find_h(s_prof.saturation, s_prof.position)
print(h)
[04:01:53] WARNING  The requested saturation range was adjusted to (0.01,                            _funcs.py:1538
                    np.float64(0.9804305283757339)) to accomodate data
――――――――――――――――――――――――――――――――――――――――――――――――――――――――――――――――――――――――――――――
Results of find_h generated at Sun Mar  1 04:01:53 2026
――――――――――――――――――――――――――――――――――――――――――――――――――――――――――――――――――――――――――――――
valid                     False
zmax                      5.0
zmin                      85.0
smax                      0.9804305283757339
smin                      0.01
h                         80.0
――――――――――――――――――――――――――――――――――――――――――――――――――――――――――――――――――――――――――――――
srange#
The object that is returned by find_h is like a dataclass, meaning it is an object with data as attributes, which can be inspected by printing it. Note that the valid attribute is False. This is because by default the function finds the distance between s_nwp=0.99 and s_nwp=0.01, however as can be seen in the above printout the maximun saturation in the image was 0.9768, so the profile did not span the requested range. This can be specified:
h = ps.metrics.find_h(s_prof.saturation, s_prof.position, srange=[0.01, 0.95])
print(h)
――――――――――――――――――――――――――――――――――――――――――――――――――――――――――――――――――――――――――――――
Results of find_h generated at Sun Mar  1 04:01:53 2026
――――――――――――――――――――――――――――――――――――――――――――――――――――――――――――――――――――――――――――――
valid                     True
zmax                      5.0
zmin                      85.0
smax                      0.95
smin                      0.01
h                         80.0
――――――――――――――――――――――――――――――――――――――――――――――――――――――――――――――――――――――――――――――