set_mpl_style#
This method prettifies matplotlib’s output by adjusting different parameters such as fonts, markersize, colormap, etc. This is useful, as it reduces the time to manually adjust those parameters on each image visualization in the notebook.
import inspect

import matplotlib.pyplot as plt
import numpy as np

import porespy as ps

inspect.signature(ps.visualization.set_mpl_style)
<Signature ()>
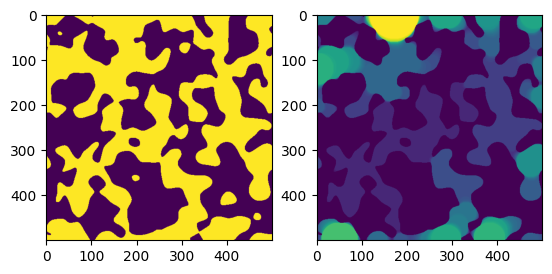
Let’s first visualize a figure without set_mpl_style:
np.random.seed(10)
im1 = ps.generators.blobs(shape=[500, 500])
im2 = ps.filters.porosimetry(im1)
fig, ax = plt.subplots(1, 2)
ax[0].imshow(im1)
ax[1].imshow(im2)
<matplotlib.image.AxesImage at 0x7f034edaf9d0>
Now let’s apply set_mple_style and visualize multiple images. Note that to apply this style on all images in the code, you can write ps.visualization.set_mpl_style() once at the beginning of the code.
ps.visualization.set_mpl_style()
fig, ax = plt.subplots(1, 2)
ax[0].imshow(im1)
ax[1].imshow(im2)
<matplotlib.image.AxesImage at 0x7f034ebb1a90>
