pc_to_satn#
Convert a capillary pressure map to saturation map.
import matplotlib.pyplot as plt

import porespy as ps

ps.visualization.set_mpl_style()
The capillary pressure map, such as that computed by ps.simulations.drainage
im = ps.generators.blobs(shape=[200, 200], porosity=0.6)
pc = ps.filters.capillary_transform(im=im, voxel_size=1, g=0)
drn = ps.simulations.drainage(im=im, pc=pc)
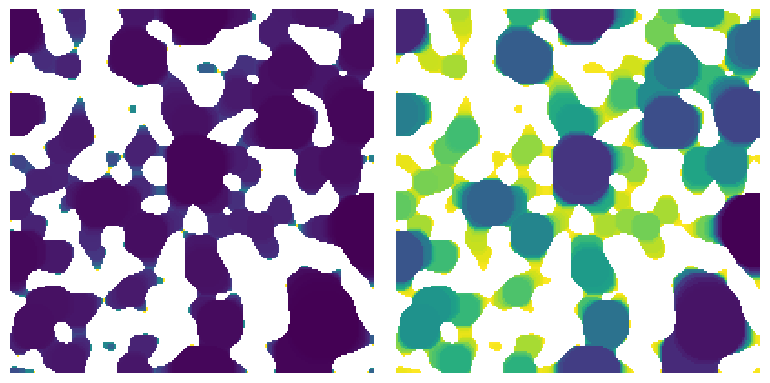
pc and im#
satn = ps.filters.pc_to_satn(pc=drn.im_pc, im=im)

fig, ax = plt.subplots(1, 2, figsize=[8, 4])
ax[0].imshow(drn.im_pc / im, interpolation="none", origin="lower")
ax[0].axis(False)
ax[1].imshow(satn / im, interpolation="none", origin="lower")
ax[1].axis(False);
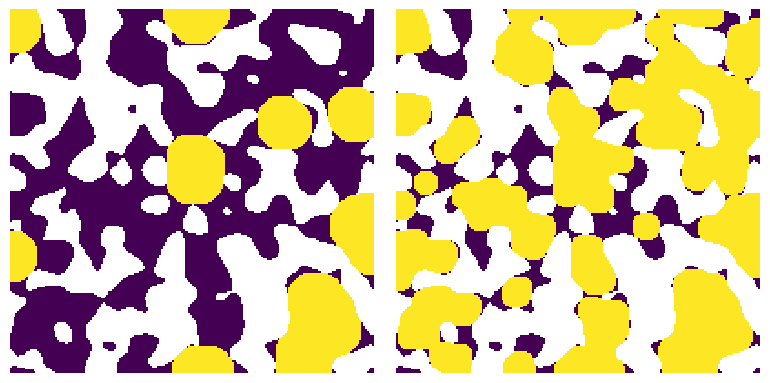
The saturation image allows for easy determination of a desired fluid configuration:
fig, ax = plt.subplots(1, 2, figsize=[8, 4])
ax[0].imshow((satn < 0.3) * (satn > 0) / im, interpolation="none", origin="lower")
ax[0].axis(False)
ax[1].imshow((satn < 0.8) * (satn > 0) / im, interpolation="none", origin="lower")
ax[1].axis(False);