flood_func#
Floods the regions of an image with values computed by the supplied numpy function.
import numpy as np
import porespy as ps
import matplotlib.pyplot as plt
import scipy.ndimage as spim
from edt import edt
from skimage.segmentation import watershed

ps.visualization.set_mpl_style()
np.random.seed(0)
func#
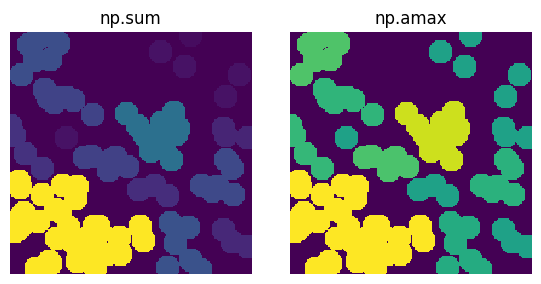
The function can be anything in numpy that operates on an array. For instance, when passing in the np.sum function it will compute the sum of voxels with each regions and replace those values with the sum. This allows for the determination of a regions size. Or, if the supplied image is the distance transform the np.amax function can be supplied to color each region by the maximum size found within it.
fig, ax = plt.subplots(1, 2, figsize=[6, 3])

im = ~ps.generators.overlapping_spheres(shape=[200, 200], porosity=0.5, r=10)
flooded = ps.filters.flood_func(im=im, func=np.sum)

ax[0].imshow(flooded)
ax[0].axis(False)
ax[0].set_title("np.sum")

dt = edt(im)
flooded = ps.filters.flood_func(im=dt, func=np.amax)
ax[1].imshow(flooded)
ax[1].axis(False)
ax[1].set_title("np.amax");

labels#
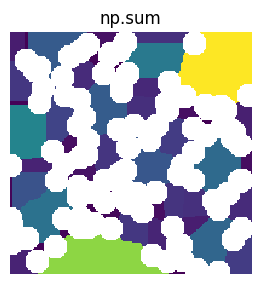
An image with each region of interest labelled. If not provided the scipy.ndimage.label function is applied.
im = ps.generators.overlapping_spheres(shape=[200, 200], porosity=0.5, r=10)
dt = edt(im)
dt = spim.gaussian_filter(dt, sigma=0.4)
pk = ps.filters.find_peaks(dt=dt)
ws = watershed(-dt, markers=spim.label(pk)[0])

flooded = ps.filters.flood_func(im=im, labels=ws, func=np.sum) * im

fig, ax = plt.subplots(1, 1, figsize=[6, 3])
ax.imshow(flooded / im)
ax.axis(False)
ax.set_title("np.sum");

