xray#
Visualize a 3D image as a 2D image in the style of an xray radiograph, with the brightness corresponding inversely to the amount of material the xray passed through.
import matplotlib.pyplot as plt

import porespy as ps

ps.visualization.set_mpl_style()
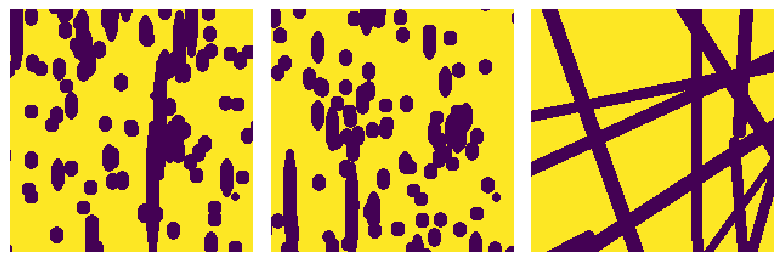
Create a test image of fibers since the orientation is useful for visualization:
im = ps.generators.cylinders(shape=[200, 200, 200], r=6, porosity=0.7)
fig, ax = plt.subplots(1, 3, figsize=[8, 12])
ax[0].imshow(im[50, :, :])
ax[0].axis(False)
ax[1].imshow(im[:, 50, :])
ax[1].axis(False)
ax[2].imshow(im[:, :, 50])
ax[2].axis(False);
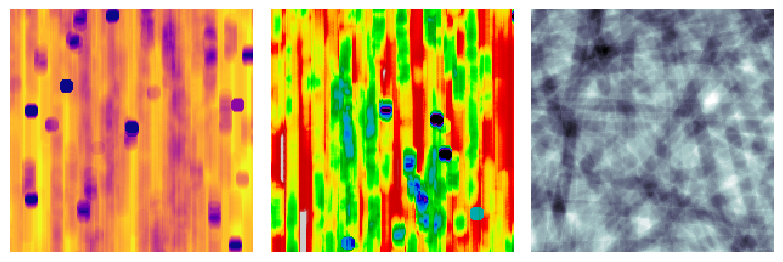
axis#
The default behavior is the view the sample as though the xrays passed along the x-axis, but this is adjustable:
fig, ax = plt.subplots(1, 3, figsize=[8, 12])

im1 = ps.visualization.xray(im)
ax[0].imshow(im1, cmap=plt.cm.plasma)
ax[0].axis(False)

im2 = ps.visualization.xray(im, axis=1)
ax[1].imshow(im2, cmap=plt.cm.nipy_spectral)
ax[1].axis(False)

im2 = ps.visualization.xray(im, axis=2)
ax[2].imshow(im2, cmap=plt.cm.bone)
ax[2].axis(False);