region_volumes#
Calculates the volume of each region in a labeled image. This method works by applying mesh_volume on each region to calculate the volume based on meshing the regions (marching cube) or by applying a summation on the number of voxels within each region.
import matplotlib.pyplot as plt
import numpy as np
import porespy as ps

ps.visualization.set_mpl_style()
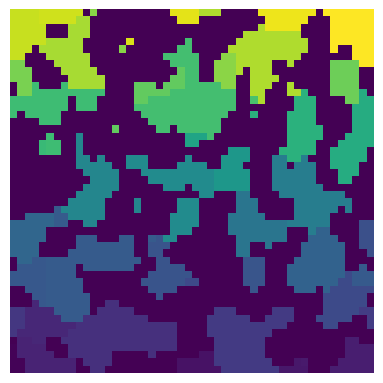
regions#
The input image of the pore space partitioned into individual pore regions. Note that zeros in the image (solid phase) will not be considered for volume calculation.
np.random.seed(10)
im = ps.generators.blobs(shape=[50, 50, 50])
snow = ps.filters.snow_partitioning(im)
regions = snow.regions

fig, ax = plt.subplots(1, 1, figsize=[4, 4])
ax.imshow(regions[:, :, 20], origin="lower", interpolation="none")
ax.axis(False);
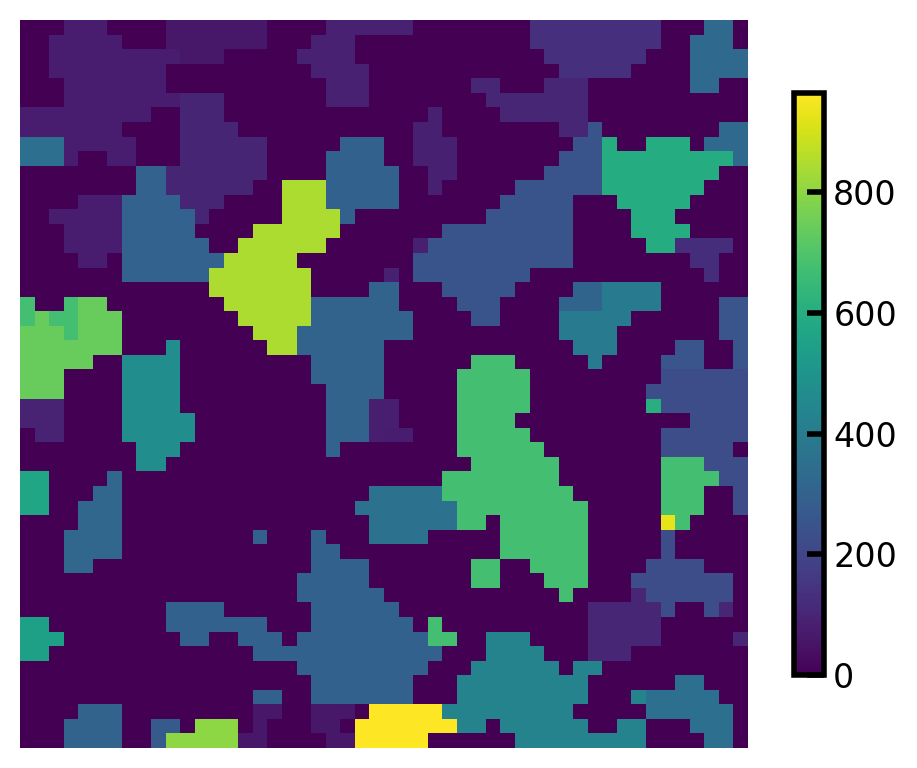
The region_volumes returns an array containing the volume of each region, offset by 1, such that the volume of region 1 is stored in element 0 of the array. We can visualize each region’s volume by assigning the returned values to each region:
vols = ps.metrics.region_volumes(regions=regions)
regions_vol = np.copy(regions)
for i in range(0, len(vols)):
    mask = np.array(np.where(regions_vol == i, regions_vol, 0), dtype=bool)
    regions_vol[mask] = vols[i]

fig, ax = plt.subplots(1, 1, figsize=[5, 4])
plt.imshow(regions_vol[:, :, 10], origin="lower", interpolation="none")
cbar = plt.colorbar(ax=ax, shrink=0.8)
ax.axis(False);
---------------------------------------------------------------------------
ModuleNotFoundError                       Traceback (most recent call last)
File ~/work/porespy/porespy/src/porespy/metrics/_meshtools.py:105, in mesh_volume(region, voxel_size)
    104 try:
--> 105     from trimesh import Trimesh
    106 except ModuleNotFoundError:

ModuleNotFoundError: No module named 'trimesh'

During handling of the above exception, another exception occurred:

ModuleNotFoundError                       Traceback (most recent call last)
Cell In[3], line 1
----> 1 vols = ps.metrics.region_volumes(regions=regions)
      2 regions_vol = np.copy(regions)
      3 for i in range(0, len(vols)):

File ~/work/porespy/porespy/src/porespy/metrics/_meshtools.py:71, in region_volumes(regions, method, voxel_size)
     69 region = regions[s] == (i + 1)
     70 if method == 'marching_cubes':
---> 71     vols[i] = mesh_volume(region, voxel_size=voxel_size)
     72 elif method.startswith('voxel'):
     73     vols[i] = region.sum(dtype=np.int64)

File ~/work/porespy/porespy/src/porespy/metrics/_meshtools.py:108, in mesh_volume(region, voxel_size)
    106 except ModuleNotFoundError:
    107     msg = 'The trimesh package can be installed with pip install trimesh'
--> 108     raise ModuleNotFoundError(msg)
    110 mc = mesh_region(region > 0, voxel_size=voxel_size)
    111 m = Trimesh(vertices=mc.verts, faces=mc.faces, vertex_normals=mc.norm)

ModuleNotFoundError: The trimesh package can be installed with pip install trimesh
method#
By default this function uses marching cube method to mesh each region and calculate the volume of each region. We can choose voxel mode where the function calculates the volume of each region by summing the number of voxels in each region.
vols = ps.metrics.region_volumes(regions=regions, method="voxel")
regions_vol = np.copy(regions)
for i in range(0, len(vols)):
    mask = np.array(np.where(regions_vol == i, regions_vol, 0), dtype=bool)
    regions_vol[mask] = vols[i]

fig, ax = plt.subplots(1, 1, figsize=[5, 4])
plt.imshow(regions_vol[:, :, 10], origin="lower", interpolation="none")
cbar = plt.colorbar(ax=ax, shrink=0.8)
ax.axis(False);