porosity_profile#
Computes the porosity profile along the given axis of an image.
import matplotlib.pyplot as plt

import porespy as ps

ps.visualization.set_mpl_style()
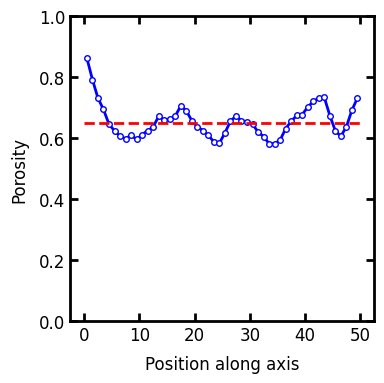
im#
The porosity is computed by summing the voxels with a value of 1. This means that in a boolean image the void space is indicated by True. If the image is multiphase (i.e. voxel values of 1, 2, …) then only the 1’s will be counted.
im = ps.generators.overlapping_spheres(shape=[50, 50, 50], r=5, porosity=0.65)
prf = ps.metrics.porosity_profile(im)

fig, ax = plt.subplots(figsize=[4, 4])
ax.plot(*prf, "b.-")
ax.plot([0, 50], [0.65, 0.65], "r--")
ax.set_ylim([0, 1])
ax.set_xlabel("Position along axis")
ax.set_ylabel("Porosity");
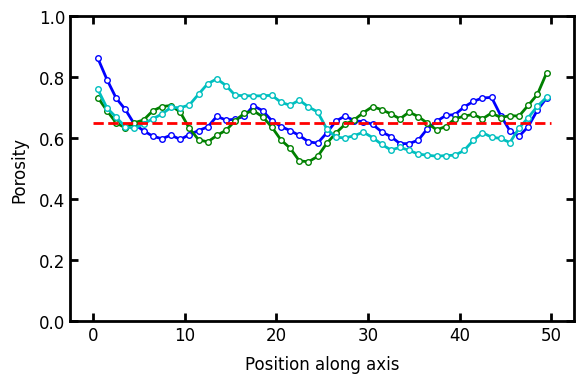
axis#
The axis along which to compute the profile. The default is axis=0.
prf0 = ps.metrics.porosity_profile(im, axis=0)
prf1 = ps.metrics.porosity_profile(im, axis=1)
prf2 = ps.metrics.porosity_profile(im, axis=2)

fig, ax = plt.subplots(figsize=[6, 4])
ax.plot(*prf0, "b.-")
ax.plot(*prf1, "g.-")
ax.plot(*prf2, "c.-")
ax.plot([0, 50], [0.65, 0.65], "r--")
ax.set_ylim([0, 1])
ax.set_xlabel("Position along axis")
ax.set_ylabel("Porosity");