show_panels#
This functions create a montage of many 2D slices through a 3D image. This is useful for very quick checks of the image to ensure the features are present, shapes are correct, etc.
import porespy as ps
im = ps.generators.blobs([20, 40, 60], blobiness=0.5)
im#
This argument receives the 3D image which is to be sliced:
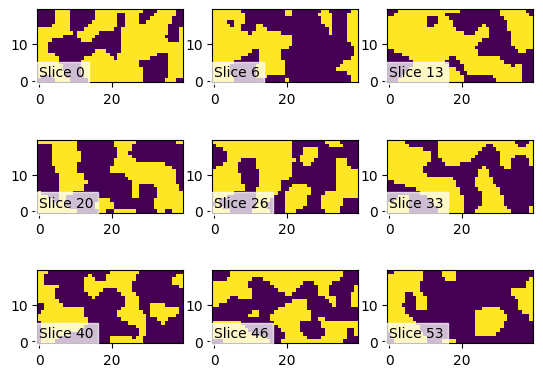
fig, ax = ps.visualization.show_panels(im)
rc#
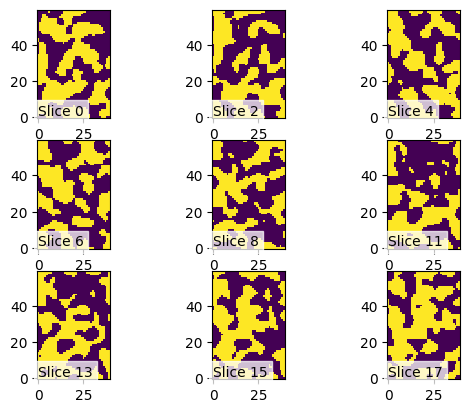
Indicates the number of rows and columns to use. The default is [3, 3]. The function will take the needed number of slices to fill in the panel complete, evenly spaced along the specified axis.
fig, ax = ps.visualization.show_panels(im, rc=[2, 4])
axis#
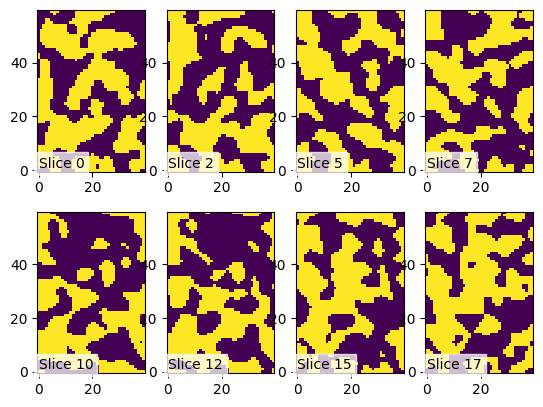
Indicates the direction which slices are taken. By default slices are taken from the x-direction (axis=0), meaning the panels are slices of the “yz-plane”.
fig, ax = ps.visualization.show_panels(im, axis=2)