snow_partitioning_n#
Similar to snow_partitioning except that it works on an image containing an arbitrary number of phases
Import packages#
import matplotlib.pyplot as plt
import numpy as np

import porespy as ps

ps.visualization.set_mpl_style()
np.random.seed(0)
im#
Generate a test 3 phase image by overlaying two 2 phase images. This works with 3D images as well.
im1 = ps.generators.blobs(shape=[200, 200], porosity=0.5, blobiness=0.75)
im2 = ps.generators.blobs(shape=[200, 200], porosity=0.5, blobiness=0.5)
im = im1.astype(int) + im2.astype(int)

plt.figure(figsize=[6, 6])
plt.axis(False)
plt.imshow(im);

Apply snow_partitioning_n filter#
The Results of the filter includes several images
snow = ps.filters.snow_partitioning_n(im)
print(snow)
――――――――――――――――――――――――――――――――――――――――――――――――――――――――――――――――――――――――――――――
Results of snow_partitioning_n generated at Sun Mar  1 03:59:51 2026
――――――――――――――――――――――――――――――――――――――――――――――――――――――――――――――――――――――――――――――
im                        Array of size (200, 200)
dt                        Array of size (200, 200)
phase_max_label           [np.int32(71), np.int32(114)]
regions                   Array of size (200, 200)
peaks                     Array of size (200, 200)
――――――――――――――――――――――――――――――――――――――――――――――――――――――――――――――――――――――――――――――
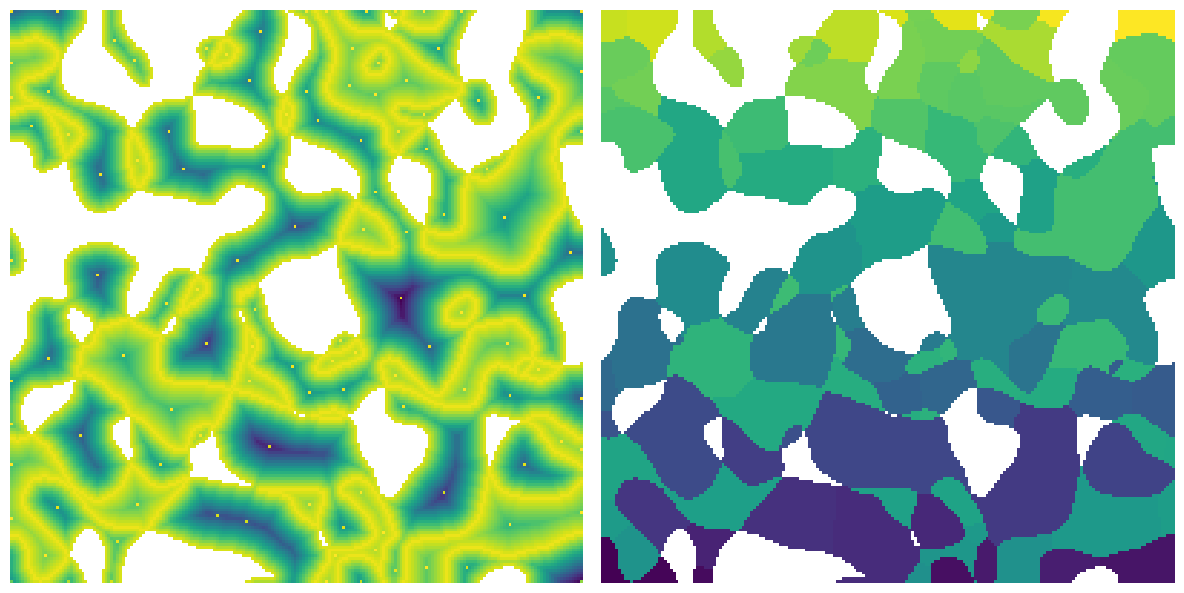
fig, ax = plt.subplots(1, 2, figsize=[12, 12])
ax[0].imshow(snow.dt / im / ~snow.peaks, origin="lower", interpolation="none")
ax[0].axis(False)
ax[1].imshow(snow.regions / im, origin="lower", interpolation="none")
ax[1].axis(False);