spheres_from_coords#
In cases where an external package is used to generate a sphere packing, this function can be used to convert the result to an ndimage.
import matplotlib.pyplot as plt
import numpy as np
import pandas as pd

import porespy as ps
df#
The function is designed to accept the input coordinates and sphere radii as a pandas DataFrame, which is why this argument is called df…although as we’ll see this is somewhat flexible.
Let assume we have 4 spheres whose x, y, and z coordinates plus their respective radii are stored as column an Excel file with each row representing a sphere. This format can be directly read into a DataFrame using df = pd.read_excel or df = pd.read_csv, which is why the DataFrame is the format of choice.
Let’s enter a DataFrame by hand for this demonstration, then print it:
df = pd.DataFrame(
    {
        "X": [10, 20, 40, 40],
        "Y": [10, 30, 50, 10],
        "Z": [0, 0, 0, 0],
        "R": [5.0, 8.0, 17.5, 4.0],
    }
)
print(df)
    X   Y  Z     R
0  10  10  0   5.0
1  20  30  0   8.0
2  40  50  0  17.5
3  40  10  0   4.0
This array of spheres is only 2D as can be seen by all the ‘Z’ values being 0. The returned image will be in 2D.
im = ps.generators.spheres_from_coords(df)
The function also accepts numpy arrays with the same format as the above DataFrame:
arr = np.array(df)
print(arr)
[[10.  10.   0.   5. ]
 [20.  30.   0.   8. ]
 [40.  50.   0.  17.5]
 [40.  10.   0.   4. ]]
im = ps.generators.spheres_from_coords(arr)
plt.imshow(im);

It is also acceptable to pass a python dict:
dct = {
    "X": [10, 20, 40, 40],
    "Y": [10, 30, 50, 10],
    "Z": [0, 0, 0, 0],
    "R": [5.0, 8.0, 17.5, 4.0],
}
im = ps.generators.spheres_from_coords(dct)
plt.imshow(im);
It is also acceptable to leave the ‘X’ or ‘Y’ columns as 0’s. The function will ignore the column with all 0’s and return a 2D image.
dct = {
    "X": [10, 20, 40, 40],
    "Y": [0, 0, 0, 0],
    "Z": [10, 30, 50, 10],
    "R": [5.0, 8.0, 17.5, 4.0],
}
im = ps.generators.spheres_from_coords(dct)
plt.imshow(im);
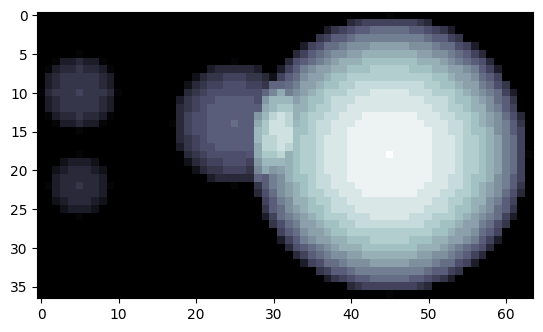
Of course, it also works with 3D images:
dct = {
    "X": [10, 20, 40, 40],
    "Y": [10, 30, 50, 10],
    "Z": [4, 8, 12, 16],
    "R": [5.0, 8.0, 17.5, 4.0],
}
im = ps.generators.spheres_from_coords(dct)
plt.imshow(ps.visualization.xray(~im, axis=0).T, cmap=plt.cm.bone_r);
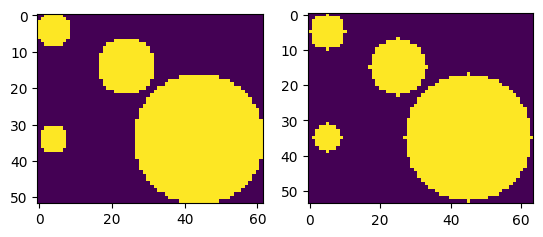
mode#
The options are 'extended' which means the spheres are allowed to extend beyond the edge of the image, and contained meaning the sphere lie fully inside the image.
im1 = ps.generators.spheres_from_coords(df, mode="extended")
im2 = ps.generators.spheres_from_coords(df, mode="contained")
fig, ax = plt.subplots(1, 2)
ax[0].imshow(im1)
ax[1].imshow(im2);
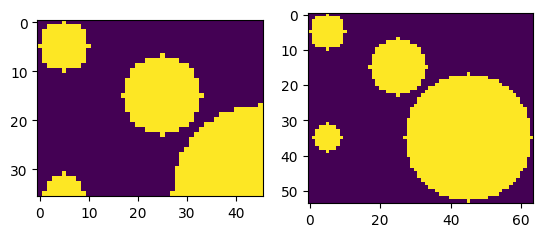
smooth#
This controls the outer shape of the spheres.
im1 = ps.generators.spheres_from_coords(df, smooth=True)
im2 = ps.generators.spheres_from_coords(df, smooth=False)
fig, ax = plt.subplots(1, 2)
ax[0].imshow(im1)
ax[1].imshow(im2);